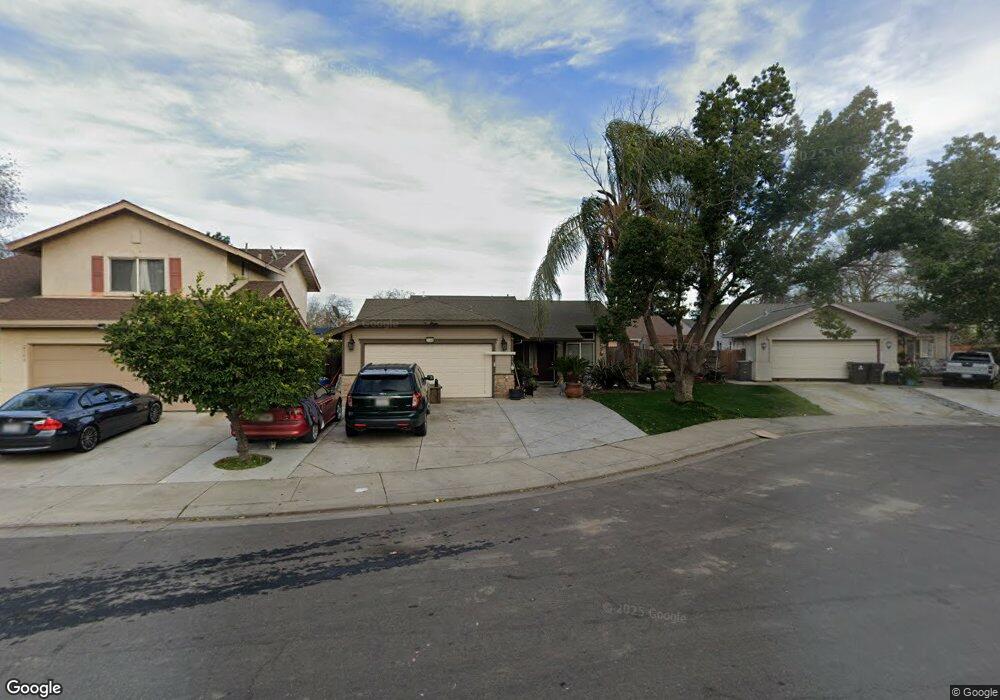
2146 Sugar Creek Ct Stockton, CA 95206
Seaport NeighborhoodEstimated Value: $333,000 - $396,000
3
Beds
1
Bath
981
Sq Ft
$381/Sq Ft
Est. Value
About This Home
This home is located at 2146 Sugar Creek Ct, Stockton, CA 95206 and is currently estimated at $373,322, approximately $380 per square foot. 2146 Sugar Creek Ct is a home located in San Joaquin County with nearby schools including San Joaquin Elementary School, John Marshall Elementary School, and Taylor Leadership Academy.
Ownership History
Date
Name
Owned For
Owner Type
Purchase Details
Closed on
Mar 26, 2016
Sold by
Gallardo Jesus Rios and De Rios Ana M Perez
Bought by
Gallardo Jesus Rios and Perez De Rios Ana M
Current Estimated Value
Home Financials for this Owner
Home Financials are based on the most recent Mortgage that was taken out on this home.
Original Mortgage
$177,900
Outstanding Balance
$128,693
Interest Rate
3.71%
Mortgage Type
New Conventional
Estimated Equity
$244,629
Purchase Details
Closed on
Nov 15, 2001
Sold by
Green Robert Douglas
Bought by
Gallardo Jesus Rios
Home Financials for this Owner
Home Financials are based on the most recent Mortgage that was taken out on this home.
Original Mortgage
$120,120
Interest Rate
6.63%
Purchase Details
Closed on
Mar 11, 1998
Sold by
Bright Development
Bought by
Green Robert D and Green Gina M
Home Financials for this Owner
Home Financials are based on the most recent Mortgage that was taken out on this home.
Original Mortgage
$87,507
Interest Rate
7.07%
Mortgage Type
FHA
Create a Home Valuation Report for This Property
The Home Valuation Report is an in-depth analysis detailing your home's value as well as a comparison with similar homes in the area
Home Values in the Area
Average Home Value in this Area
Purchase History
| Date | Buyer | Sale Price | Title Company |
|---|---|---|---|
| Gallardo Jesus Rios | -- | Pacific Coast Title Company | |
| Gallardo Jesus Rios | $143,000 | Alliance Title Company | |
| Green Robert D | $88,500 | North American Title Co |
Source: Public Records
Mortgage History
| Date | Status | Borrower | Loan Amount |
|---|---|---|---|
| Open | Gallardo Jesus Rios | $177,900 | |
| Closed | Gallardo Jesus Rios | $120,120 | |
| Previous Owner | Green Robert D | $87,507 |
Source: Public Records
Tax History Compared to Growth
Tax History
| Year | Tax Paid | Tax Assessment Tax Assessment Total Assessment is a certain percentage of the fair market value that is determined by local assessors to be the total taxable value of land and additions on the property. | Land | Improvement |
|---|---|---|---|---|
| 2025 | $2,744 | $211,238 | $62,040 | $149,198 |
| 2024 | $2,700 | $207,097 | $60,824 | $146,273 |
| 2023 | $2,640 | $203,037 | $59,632 | $143,405 |
| 2022 | $2,524 | $199,057 | $58,463 | $140,594 |
| 2021 | $2,431 | $195,155 | $57,317 | $137,838 |
| 2020 | $2,478 | $193,155 | $56,730 | $136,425 |
| 2019 | $2,468 | $189,368 | $55,618 | $133,750 |
| 2018 | $2,843 | $185,656 | $54,528 | $131,128 |
| 2017 | $2,627 | $182,016 | $53,459 | $128,557 |
| 2016 | $2,561 | $178,448 | $52,411 | $126,037 |
| 2015 | $2,088 | $139,000 | $41,000 | $98,000 |
| 2014 | $1,782 | $120,000 | $36,000 | $84,000 |
Source: Public Records
Map
Nearby Homes
- 2050 Grey Stone Dr
- 1823 Fort Hall Place
- 2128 Green River Ln
- 2650 S Fresno Ave
- 1409 Laguna Cir
- 1413 Laguna Cir
- 2215 Dune Place
- 1156 Derrick Dr
- 1232 Denver Ave
- 2428 Shell Ct
- 2402 Sailboat Ct
- 2625 Crestmore Cir
- 2079 Gordon Verner Cir
- 3745 Wild Rose Ln
- 2242 Port Trinity Cir
- 1661 W Hazelton Ave
- 864 W 5th St
- 309 S Los Angeles Ave
- 348 S Los Angeles Ave
- 3779 Zeally Ln
- 2140 Sugar Creek Ct
- 2158 Sugar Creek Ct
- 2728 Houston Ave
- 2132 Sugar Creek Ct
- 2716 Houston Ave
- 2740 Houston Ave
- 2164 Sugar Creek Ct
- 2752 Houston Ave
- 2704 Houston Ave
- 2124 Sugar Creek Ct
- 2145 Sugar Creek Ct
- 2139 Sugar Creek Ct
- 2764 Houston Ave
- 2157 Sugar Creek Ct
- 2131 Sugar Creek Ct
- 2163 Sugar Creek Ct
- 2116 Sugar Creek Ct
- 2123 Sugar Creek Ct
- 2776 Houston Ave
- 2174 Stormy Creek Ct