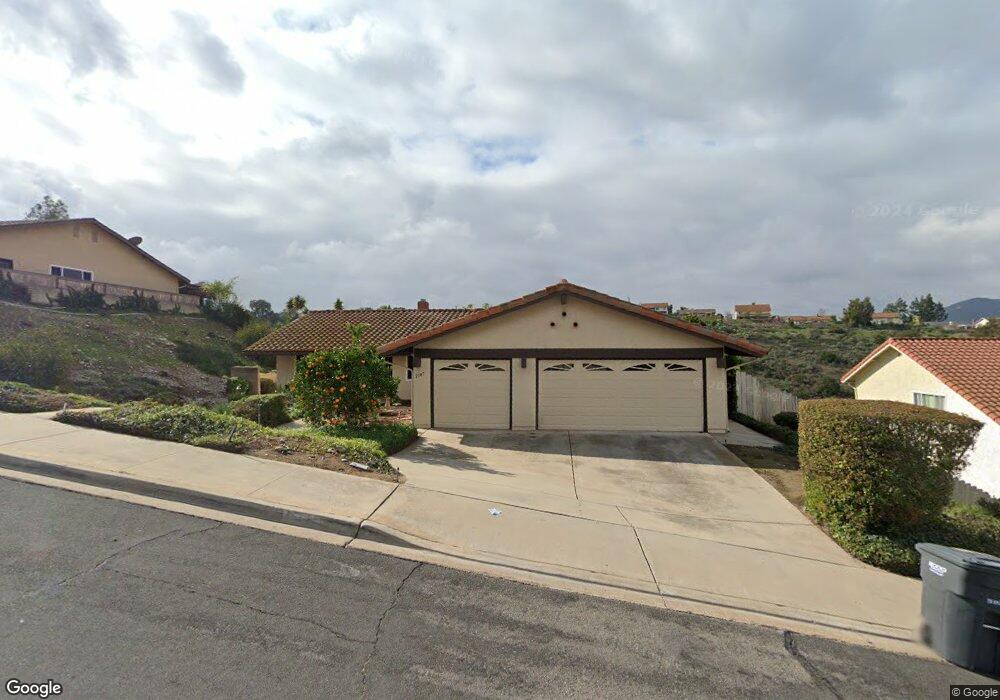
2147 Flying Hills Ln El Cajon, CA 92020
Fletcher Hills NeighborhoodEstimated Value: $974,499 - $1,110,000
3
Beds
2
Baths
1,950
Sq Ft
$528/Sq Ft
Est. Value
About This Home
This home is located at 2147 Flying Hills Ln, El Cajon, CA 92020 and is currently estimated at $1,028,875, approximately $527 per square foot. 2147 Flying Hills Ln is a home located in San Diego County with nearby schools including Fletcher Hills Elementary School, Parkway Academy, and West Hills High School.
Ownership History
Date
Name
Owned For
Owner Type
Purchase Details
Closed on
Mar 11, 2015
Sold by
Kishi Michael K
Bought by
Kishi Michael Katsuji and The Kishi Trust
Current Estimated Value
Purchase Details
Closed on
Oct 17, 2001
Sold by
Player Andrew Mark and Player Roni Sue
Bought by
Kishi Michael K
Home Financials for this Owner
Home Financials are based on the most recent Mortgage that was taken out on this home.
Original Mortgage
$270,400
Outstanding Balance
$103,367
Interest Rate
6.57%
Estimated Equity
$925,508
Purchase Details
Closed on
Aug 29, 2000
Sold by
Player Andrew M and Player Roni S
Bought by
Player Andrew Mark and Player Roni Sue
Purchase Details
Closed on
Sep 13, 1993
Sold by
Holden Joseph L and Holden Jackie L
Bought by
Player Andrew Mark and Player Roni Sue
Purchase Details
Closed on
Jun 12, 1986
Purchase Details
Closed on
Aug 13, 1985
Create a Home Valuation Report for This Property
The Home Valuation Report is an in-depth analysis detailing your home's value as well as a comparison with similar homes in the area
Home Values in the Area
Average Home Value in this Area
Purchase History
| Date | Buyer | Sale Price | Title Company |
|---|---|---|---|
| Kishi Michael Katsuji | -- | None Available | |
| Kishi Michael K | $338,000 | Fidelity Title | |
| Player Andrew Mark | -- | -- | |
| Player Andrew Mark | -- | -- | |
| Player Andrew Mark | -- | Fidelity National Title | |
| -- | $175,000 | -- | |
| -- | $164,000 | -- |
Source: Public Records
Mortgage History
| Date | Status | Borrower | Loan Amount |
|---|---|---|---|
| Open | Kishi Michael K | $270,400 | |
| Closed | Kishi Michael K | $33,800 |
Source: Public Records
Tax History Compared to Growth
Tax History
| Year | Tax Paid | Tax Assessment Tax Assessment Total Assessment is a certain percentage of the fair market value that is determined by local assessors to be the total taxable value of land and additions on the property. | Land | Improvement |
|---|---|---|---|---|
| 2025 | $6,354 | $498,785 | $166,080 | $332,705 |
| 2024 | $6,354 | $489,006 | $162,824 | $326,182 |
| 2023 | $6,209 | $479,419 | $159,632 | $319,787 |
| 2022 | $6,767 | $470,019 | $156,502 | $313,517 |
| 2021 | $6,340 | $460,804 | $153,434 | $307,370 |
| 2020 | $5,620 | $456,080 | $151,861 | $304,219 |
| 2019 | $5,136 | $447,138 | $148,884 | $298,254 |
| 2018 | $5,028 | $438,371 | $145,965 | $292,406 |
| 2017 | $4,955 | $429,776 | $143,103 | $286,673 |
| 2016 | $4,792 | $421,350 | $140,298 | $281,052 |
| 2015 | $4,758 | $415,022 | $138,191 | $276,831 |
| 2014 | $4,661 | $406,894 | $135,485 | $271,409 |
Source: Public Records
Map
Nearby Homes
- 2052 Flying Hills Ln
- 0 Hacienda Dr
- 2106 Windmill View Rd
- 1677 Heron Ave
- 2527 Gibbons St
- 2524 Seattle Dr
- 2548 Katherine Ct
- 1958 Milford Place
- 700 Wakefield Ct
- 1951 Belmore Ct
- 2528 Windmill View Rd
- 1340 Heron Ave
- 731 Dewane Dr
- 2148 Estela Dr
- 2213 Chatham St
- 2182 Farrington Dr
- 1387 Weers St
- 9254 Lake Murray Blvd Unit B
- 2161 Puesta Place
- 9411 Lake Murray Blvd Unit B
- 2159 Flying Hills Ln
- 2135 Flying Hills Ln
- 2123 Flying Hills Ln
- 2122 Flying Hills Ln
- 2162 Flying Hills Ln
- 2111 Flying Hills Ln
- 2177 Flying Hills Ln
- 2083 Flying Hills Ln
- 2174 Flying Hills Ln
- 2076 Flying Hills Ln
- 2133 Grafton St
- 2060 Flying Hills Ln
- 2145 Grafton St
- 2061 Flying Hills Ln
- 2157 Grafton St
- 2121 Grafton St
- 2169 Grafton St
- 2173 Grafton St
- 2049 Flying Hills Ct
- 2181 Grafton St