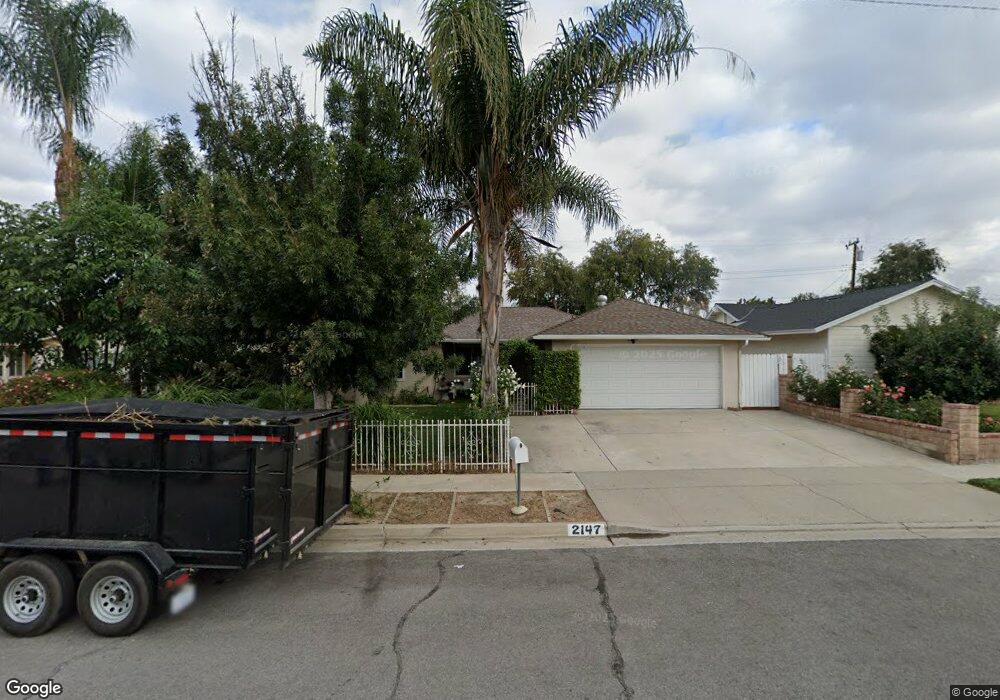
2147 Torrance St Simi Valley, CA 93065
Central Simi Valley NeighborhoodEstimated Value: $747,359 - $842,000
4
Beds
2
Baths
1,304
Sq Ft
$611/Sq Ft
Est. Value
About This Home
This home is located at 2147 Torrance St, Simi Valley, CA 93065 and is currently estimated at $797,340, approximately $611 per square foot. 2147 Torrance St is a home located in Ventura County with nearby schools including Crestview Elementary School, Hillside Middle School, and Royal High School.
Ownership History
Date
Name
Owned For
Owner Type
Purchase Details
Closed on
Aug 7, 2002
Sold by
Strain Mark Damian and Strain Shelia J
Bought by
Rodriguez Armando and Rodriguez Francy
Current Estimated Value
Home Financials for this Owner
Home Financials are based on the most recent Mortgage that was taken out on this home.
Original Mortgage
$60,000
Interest Rate
5.96%
Mortgage Type
Stand Alone Second
Create a Home Valuation Report for This Property
The Home Valuation Report is an in-depth analysis detailing your home's value as well as a comparison with similar homes in the area
Home Values in the Area
Average Home Value in this Area
Purchase History
| Date | Buyer | Sale Price | Title Company |
|---|---|---|---|
| Rodriguez Armando | $300,000 | Chicago Title |
Source: Public Records
Mortgage History
| Date | Status | Borrower | Loan Amount |
|---|---|---|---|
| Closed | Rodriguez Armando | $60,000 | |
| Open | Rodriguez Armando | $240,000 |
Source: Public Records
Tax History Compared to Growth
Tax History
| Year | Tax Paid | Tax Assessment Tax Assessment Total Assessment is a certain percentage of the fair market value that is determined by local assessors to be the total taxable value of land and additions on the property. | Land | Improvement |
|---|---|---|---|---|
| 2025 | $5,392 | $434,477 | $173,789 | $260,688 |
| 2024 | $5,392 | $425,958 | $170,381 | $255,577 |
| 2023 | $5,069 | $417,606 | $167,040 | $250,566 |
| 2022 | $5,041 | $409,418 | $163,765 | $245,653 |
| 2021 | $4,998 | $401,391 | $160,554 | $240,837 |
| 2020 | $4,891 | $397,276 | $158,908 | $238,368 |
| 2019 | $4,667 | $389,488 | $155,793 | $233,695 |
| 2018 | $4,623 | $381,852 | $152,739 | $229,113 |
| 2017 | $4,517 | $374,366 | $149,745 | $224,621 |
| 2016 | $4,312 | $367,026 | $146,809 | $220,217 |
| 2015 | $4,218 | $361,514 | $144,604 | $216,910 |
| 2014 | $4,155 | $354,434 | $141,772 | $212,662 |
Source: Public Records
Map
Nearby Homes
- 2221 Fitzgerald Rd
- 2277 Stinson St
- 2346 Royal Ave Unit 9
- 2327 Royal Ave
- 2025 Royal Ave
- 1917 Fitzgerald Rd
- 1277 Erringer Rd
- 1855 Arcane St
- 1290 Lawrence Cir
- 2466 Royal Ave
- 1847 Fitzgerald Rd
- 2095 Morley St
- 887 Erringer Rd
- 833 Crosby Ave
- 1858 Sutter Ave
- 1748 Sutter Ave
- 1948 Heywood St Unit L
- 1937 Arielle Ln
- 1932 Heywood St Unit B
- 2159 Torrance St
- 2135 Torrance St
- 2148 Cutler St
- 2160 Cutler St
- 2136 Cutler St
- 2171 Torrance St
- 2123 Torrance St
- 2146 Torrance St
- 2172 Cutler St
- 2124 Cutler St
- 2158 Torrance St
- 2134 Torrance St
- 2183 Torrance St
- 2174 Torrance St
- 2122 Torrance St
- 2184 Cutler St
- 2182 Torrance St
- 2191 Torrance St
- 2135 Rosecrans St
- 2149 Cutler St