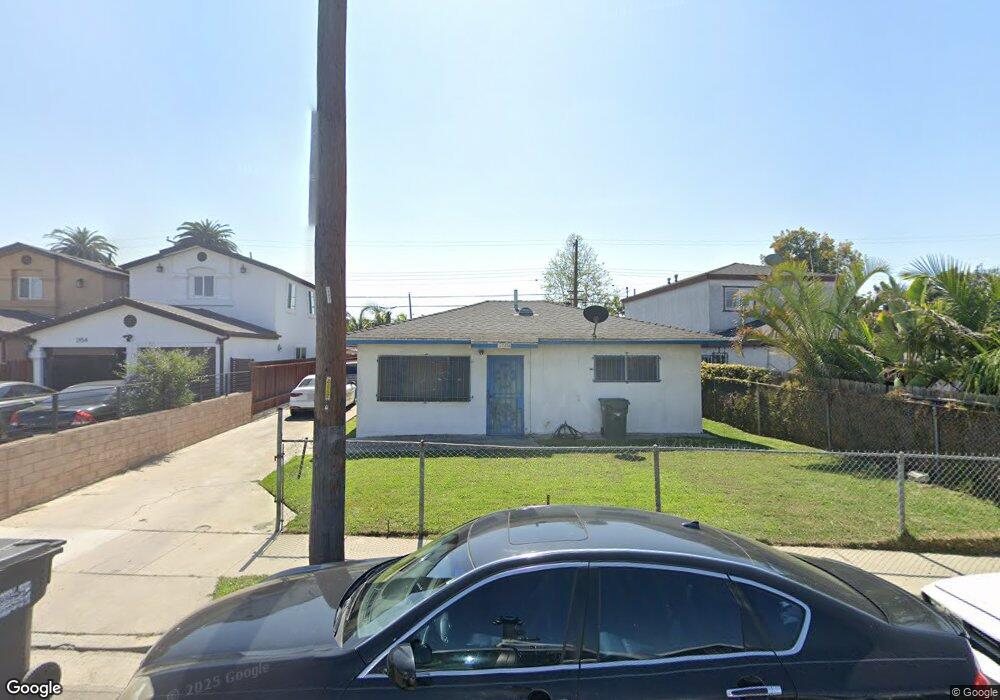
2148 E Hatchway St Compton, CA 90222
Estimated Value: $549,000 - $614,983
4
Beds
2
Baths
1,440
Sq Ft
$398/Sq Ft
Est. Value
About This Home
This home is located at 2148 E Hatchway St, Compton, CA 90222 and is currently estimated at $572,996, approximately $397 per square foot. 2148 E Hatchway St is a home located in Los Angeles County with nearby schools including Washington Elementary School, Bunche Middle School, and Centennial High School.
Ownership History
Date
Name
Owned For
Owner Type
Purchase Details
Closed on
Dec 21, 2017
Sold by
Neely John Carlton and Johnnie Grace Neely Family Tru
Bought by
Neely John Carlton
Current Estimated Value
Purchase Details
Closed on
Oct 3, 1995
Sold by
Neely Johnnie Grace
Bought by
Neely Johnnie Grace and Johnnie Grace Neely Family Tru
Create a Home Valuation Report for This Property
The Home Valuation Report is an in-depth analysis detailing your home's value as well as a comparison with similar homes in the area
Home Values in the Area
Average Home Value in this Area
Purchase History
| Date | Buyer | Sale Price | Title Company |
|---|---|---|---|
| Neely John Carlton | -- | None Available | |
| Neely Johnnie Grace | -- | -- |
Source: Public Records
Tax History
| Year | Tax Paid | Tax Assessment Tax Assessment Total Assessment is a certain percentage of the fair market value that is determined by local assessors to be the total taxable value of land and additions on the property. | Land | Improvement |
|---|---|---|---|---|
| 2025 | $1,725 | $38,429 | $10,754 | $27,675 |
| 2024 | $1,725 | $37,677 | $10,544 | $27,133 |
| 2023 | $1,541 | $36,939 | $10,338 | $26,601 |
| 2022 | $1,494 | $36,216 | $10,136 | $26,080 |
| 2021 | $1,488 | $35,507 | $9,938 | $25,569 |
| 2020 | $1,474 | $35,544 | $9,837 | $25,707 |
| 2019 | $1,463 | $34,856 | $9,645 | $25,211 |
| 2018 | $1,361 | $34,181 | $9,456 | $24,725 |
| 2016 | $1,298 | $32,472 | $9,090 | $23,382 |
| 2015 | $1,268 | $31,985 | $8,954 | $23,031 |
| 2014 | $1,269 | $31,359 | $8,779 | $22,580 |
Source: Public Records
Map
Nearby Homes
- 2223 E Oris St
- 2107 E Stockwell St
- 2102 E Lucien St
- 2062 E Hatchway St
- 2310 E Stockwell St
- 348 W Peach St
- 2401 E Hatchway St
- 13115 S Largo Ave
- 1808 N Grape Ave
- 1608 N Grape Ave
- 521 W Cherry St
- 701 W 139th St
- 720 W 137th St
- 522 W Cherry St
- 629 W Plum St
- 363 W Spruce St
- 2511 E 131st St
- 418 W Spruce St
- 2207 N Anzac Ave
- 2605 E 132nd St
- 2146 E Hatchway St
- 2154 E Hatchway St
- 2156 E Hatchway St
- 2140 E Hatchway St
- 2153 E Bliss St
- 2160 E Hatchway St
- 2147 E Bliss St
- 2138 E Hatchway St
- 2159 E Bliss St
- 2145 E Bliss St
- 2134 E Hatchway St
- 2153 E Hatchway St
- 2143 E Hatchway St
- 2159 E Hatchway St
- 0 Hatchway Unit DW14209110
- 2141 E Bliss St
- 2157 E Hatchway St
- 2163 E Bliss St
- 2145 E Hatchway St
- 2161 E Hatchway St
Your Personal Tour Guide
Ask me questions while you tour the home.