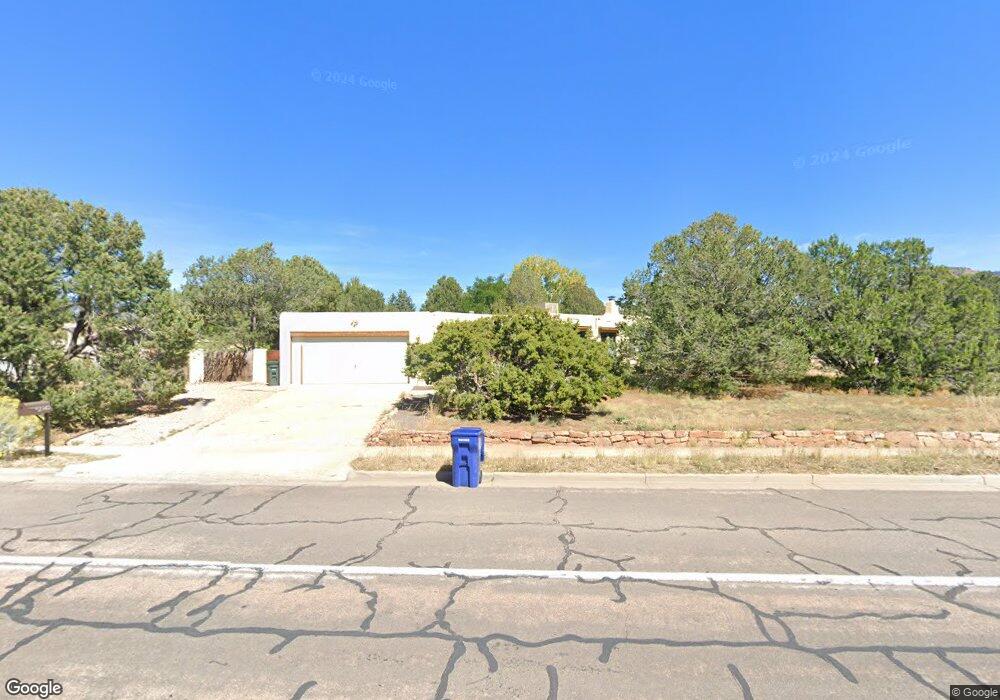
2149 Calle de Sebastian Santa Fe, NM 87505
Southeast NeighborhoodEstimated Value: $640,000 - $745,620
3
Beds
2
Baths
1,741
Sq Ft
$394/Sq Ft
Est. Value
About This Home
This home is located at 2149 Calle de Sebastian, Santa Fe, NM 87505 and is currently estimated at $686,405, approximately $394 per square foot. 2149 Calle de Sebastian is a home located in Santa Fe County with nearby schools including Wood-Gormley Elementary School, Santa Fe High School, and Little Earth School.
Ownership History
Date
Name
Owned For
Owner Type
Purchase Details
Closed on
Nov 22, 2019
Sold by
Freschet Gina
Bought by
Cieslwaski Steve
Current Estimated Value
Home Financials for this Owner
Home Financials are based on the most recent Mortgage that was taken out on this home.
Original Mortgage
$367,000
Outstanding Balance
$322,865
Interest Rate
3.6%
Mortgage Type
New Conventional
Estimated Equity
$363,540
Purchase Details
Closed on
Jan 22, 2019
Sold by
Grimson James A and Grimson Sherrie L
Bought by
Steve Freschet Gina and Steve Clelslawski
Home Financials for this Owner
Home Financials are based on the most recent Mortgage that was taken out on this home.
Original Mortgage
$364,000
Interest Rate
4.6%
Mortgage Type
New Conventional
Purchase Details
Closed on
Jul 13, 1999
Sold by
Grimson James A
Bought by
Grimson James A and Grimson Sherie L
Create a Home Valuation Report for This Property
The Home Valuation Report is an in-depth analysis detailing your home's value as well as a comparison with similar homes in the area
Home Values in the Area
Average Home Value in this Area
Purchase History
| Date | Buyer | Sale Price | Title Company |
|---|---|---|---|
| Cieslwaski Steve | -- | Stewart Title | |
| Steve Freschet Gina | -- | Santa Fe Title Co | |
| Grimson James A | -- | -- |
Source: Public Records
Mortgage History
| Date | Status | Borrower | Loan Amount |
|---|---|---|---|
| Open | Cieslwaski Steve | $367,000 | |
| Closed | Steve Freschet Gina | $364,000 |
Source: Public Records
Tax History Compared to Growth
Tax History
| Year | Tax Paid | Tax Assessment Tax Assessment Total Assessment is a certain percentage of the fair market value that is determined by local assessors to be the total taxable value of land and additions on the property. | Land | Improvement |
|---|---|---|---|---|
| 2024 | $3,558 | $472,957 | $174,836 | $298,121 |
| 2023 | $3,557 | $459,182 | $169,744 | $289,438 |
| 2022 | $3,477 | $445,808 | $164,800 | $281,008 |
| 2021 | $3,422 | $144,275 | $53,333 | $90,942 |
| 2020 | $3,394 | $143,247 | $49,999 | $93,248 |
| 2019 | $2,269 | $94,953 | $39,555 | $55,398 |
| 2018 | $2,266 | $92,187 | $38,403 | $53,784 |
| 2017 | $2,209 | $89,502 | $36,546 | $52,956 |
| 2016 | $2,083 | $86,896 | $35,482 | $51,414 |
| 2015 | $1,987 | $84,365 | $32,555 | $51,810 |
| 2014 | $1,867 | $81,827 | $30,313 | $51,513 |
Source: Public Records
Map
Nearby Homes
- 125 Chamiso Ln
- 2116 Conejo Dr
- 150 Calle Ojo Feliz
- 147 Calle Ojo Feliz Unit U
- 149 Calle Ojo Feliz Unit B
- 102 Calle Paula
- 151 Calle Ojo Feliz
- 151 Calle Ojo Feliz Unit T
- 2175 Old Arroyo Chamiso Unit 1,,2,3,4,5,6
- 157 Calle Ojo Feliz Unit D
- 1566 Camino Amado
- 826 1/2 E Zia Rd
- 123 E Lupita Rd
- 827 Viejo Rastro
- 2347 Botulph Rd
- 2328 Calle Camarico
- 756 Placita Santa Fe
- 2340 Santa Barbara Dr
- 122 W San Mateo Rd
- 2306 Brother Luke Place
- 632 Calle de Valdez
- 2141 Calle de Sebastian
- 504 Calle de Francisco
- 504 Calle de Francisco
- 630 Calle de Valdez
- 2148 Calle de Sebastian
- 2153 Calle de Sebastian
- 633 Calle de Valdez
- 508 Calle de Francisco
- 631 Calle de Valdez
- 2154 Calle de Sebastian
- 2150 Calle de Sebastian
- 2146 Calle de Sebastian
- 2152 Calle de Sebastian
- 628 Calle de Valdez
- 2133 Calle de Sebastian
- 2142 Calle de Sebastian
- 512 Calle de Francisco
- 2138 Calle de Sebastian
- 626 Calle de Valdez