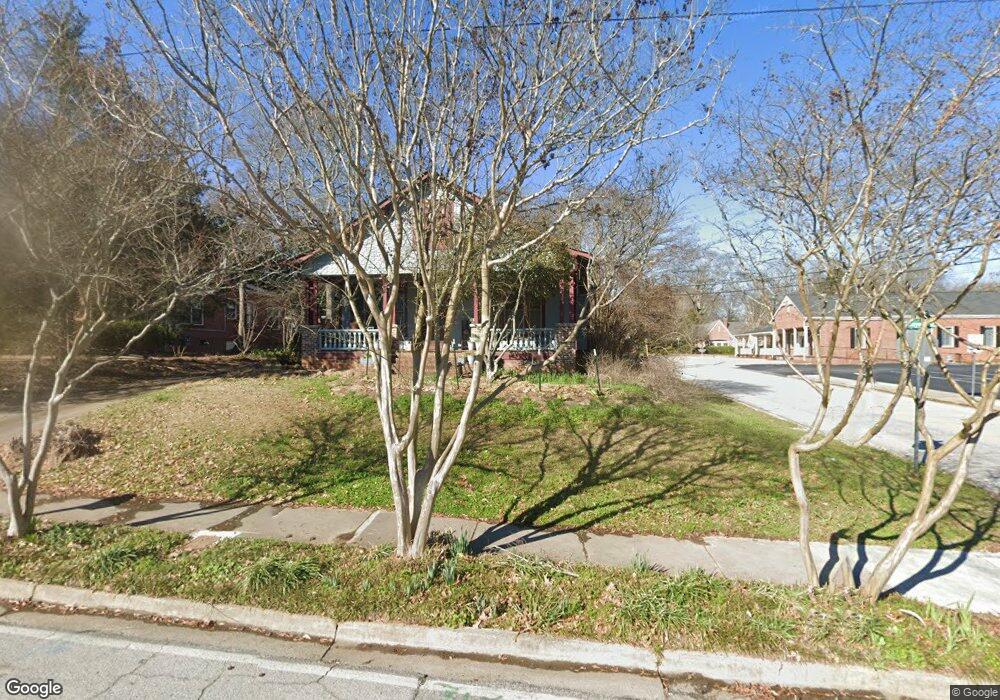
2149 Conyers St SE Covington, GA 30014
Estimated Value: $330,117 - $423,000
Studio
2
Baths
2,288
Sq Ft
$172/Sq Ft
Est. Value
About This Home
This home is located at 2149 Conyers St SE, Covington, GA 30014 and is currently estimated at $392,779, approximately $171 per square foot. 2149 Conyers St SE is a home located in Newton County with nearby schools including East Newton Elementary School, Cousins Middle School, and Eastside High School.
Ownership History
Date
Name
Owned For
Owner Type
Purchase Details
Closed on
Jul 10, 2003
Sold by
Durusau Carol H
Bought by
Durusau Patrick and Durusau Carol
Current Estimated Value
Home Financials for this Owner
Home Financials are based on the most recent Mortgage that was taken out on this home.
Original Mortgage
$168,000
Outstanding Balance
$69,251
Interest Rate
5.2%
Mortgage Type
New Conventional
Estimated Equity
$323,528
Purchase Details
Closed on
Dec 21, 2000
Sold by
Christian Frank E
Bought by
Durusau Carol H
Home Financials for this Owner
Home Financials are based on the most recent Mortgage that was taken out on this home.
Original Mortgage
$165,000
Interest Rate
7.81%
Mortgage Type
New Conventional
Purchase Details
Closed on
Apr 26, 1999
Sold by
Parrott Peggy R
Bought by
Christian Frank E
Home Financials for this Owner
Home Financials are based on the most recent Mortgage that was taken out on this home.
Original Mortgage
$55,000
Interest Rate
7.13%
Mortgage Type
New Conventional
Create a Home Valuation Report for This Property
The Home Valuation Report is an in-depth analysis detailing your home's value as well as a comparison with similar homes in the area
Home Values in the Area
Average Home Value in this Area
Purchase History
| Date | Buyer | Sale Price | Title Company |
|---|---|---|---|
| Durusau Patrick | -- | -- | |
| Durusau Carol H | $191,000 | -- | |
| Christian Frank E | $60,000 | -- |
Source: Public Records
Mortgage History
| Date | Status | Borrower | Loan Amount |
|---|---|---|---|
| Open | Durusau Patrick | $168,000 | |
| Previous Owner | Durusau Carol H | $165,000 | |
| Previous Owner | Christian Frank E | $55,000 |
Source: Public Records
Tax History
| Year | Tax Paid | Tax Assessment Tax Assessment Total Assessment is a certain percentage of the fair market value that is determined by local assessors to be the total taxable value of land and additions on the property. | Land | Improvement |
|---|---|---|---|---|
| 2025 | $3,632 | $133,504 | $15,280 | $118,224 |
| 2024 | $3,162 | $109,864 | $15,280 | $94,584 |
| 2023 | $3,156 | $102,264 | $15,280 | $86,984 |
| 2022 | $1,776 | $57,880 | $15,280 | $42,600 |
| 2021 | $1,862 | $54,520 | $17,600 | $36,920 |
| 2020 | $2,205 | $58,560 | $21,760 | $36,800 |
| 2019 | $2,227 | $58,080 | $21,760 | $36,320 |
| 2018 | $2,197 | $56,720 | $21,760 | $34,960 |
| 2017 | $2,219 | $57,240 | $21,760 | $35,480 |
| 2016 | $2,103 | $54,440 | $20,000 | $34,440 |
| 2015 | $2,057 | $53,240 | $20,000 | $33,240 |
| 2014 | $2,058 | $53,240 | $0 | $0 |
Source: Public Records
Map
Nearby Homes
- 2173 Conyers St SE
- 2225 East St
- 1155 Floyd St NE
- 1133 Church St SE Unit 2
- 1133 Church St SE Unit 1
- 3160 Butler Ave SE
- 3149 Thompson Ave SE
- 2173 Anderson Ave SE
- 13806 Homer Ln
- 0 Old Covered Bridge Rd Unit 10618938
- 13709 Whitman Ln
- 2222 Lee St SW
- 2220 Lee St SW
- 4147 Elizabeth St NE
- 4128 Elizabeth St NE
- 3148 Rebecca St SW
- 4217 Elizabeth St NE
- 4138 Pemberton Dr SE
- 4117 N Dearing St NE
- 5118 Floyd St NE
- 2109 Davis St SE
- 2136 Conyers St SE
- 1123 Davis St SE
- 2146 Conyers St SE
- 2166 Conyers St SE
- 2143 East St SE
- 2126 Conyers St SE
- 1115 Davis St SE
- 2179 Conyers St SE
- 2134 East St SE
- 2135 East St SE
- 2119 Thompson Ave SE
- 1107 Davis St SE
- 2186 East St
- 2143 Davis St SE
- 2145 Anderson Ave SE
- 1143 Oak St SE
- 2112 Anderson Ave SE
- 1373 P J E
- 2176 Conyers St SE
Your Personal Tour Guide
Ask me questions while you tour the home.