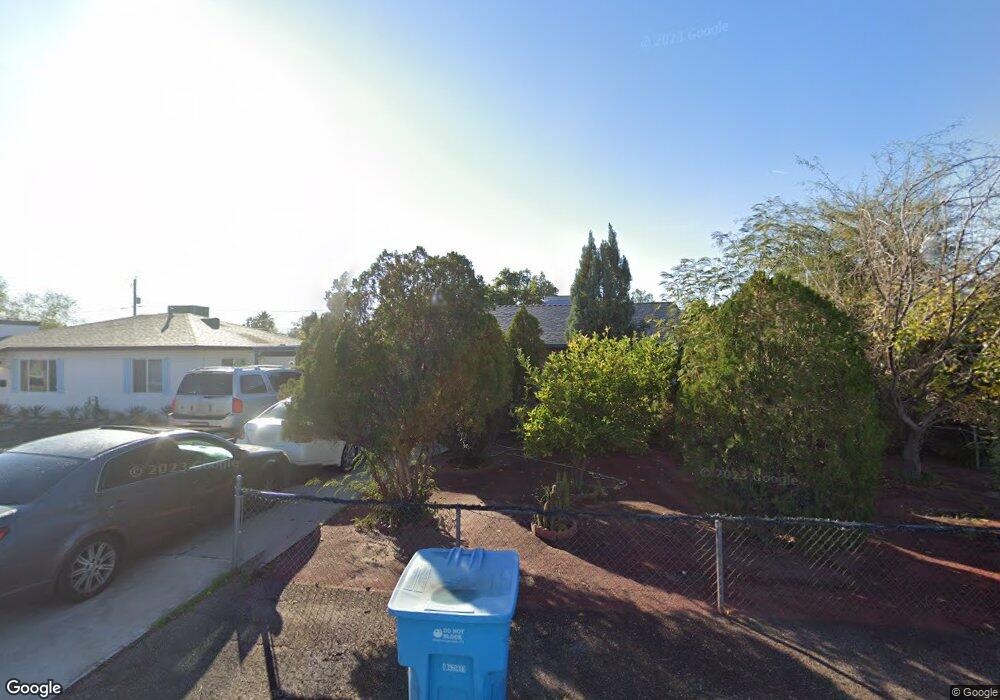
2149 W Minnezona Ave Phoenix, AZ 85015
Alhambra NeighborhoodEstimated Value: $313,546 - $399,000
--
Bed
2
Baths
1,416
Sq Ft
$262/Sq Ft
Est. Value
About This Home
This home is located at 2149 W Minnezona Ave, Phoenix, AZ 85015 and is currently estimated at $370,637, approximately $261 per square foot. 2149 W Minnezona Ave is a home located in Maricopa County with nearby schools including Westwood Primary School, Choice Learning Academy, and Central High School.
Ownership History
Date
Name
Owned For
Owner Type
Purchase Details
Closed on
Oct 25, 2005
Sold by
Mata Leticia
Bought by
Caballero Roberto
Current Estimated Value
Home Financials for this Owner
Home Financials are based on the most recent Mortgage that was taken out on this home.
Original Mortgage
$15,000
Outstanding Balance
$8,037
Interest Rate
5.68%
Mortgage Type
Credit Line Revolving
Estimated Equity
$362,600
Purchase Details
Closed on
Dec 30, 2003
Sold by
Comer Roxie I
Bought by
Long Robert G
Purchase Details
Closed on
Mar 18, 1998
Sold by
Mata Leticia
Bought by
Caballero Roberto
Purchase Details
Closed on
Mar 13, 1998
Sold by
Dunlap Edna E
Bought by
Smith Irene M
Create a Home Valuation Report for This Property
The Home Valuation Report is an in-depth analysis detailing your home's value as well as a comparison with similar homes in the area
Home Values in the Area
Average Home Value in this Area
Purchase History
| Date | Buyer | Sale Price | Title Company |
|---|---|---|---|
| Caballero Roberto | -- | Fidelity National Title | |
| Long Robert G | $25,000 | First Financial Title Agency | |
| Caballero Roberto | -- | Century Title Agency | |
| Caballero Roberto | $74,000 | Century Title Agency | |
| Smith Irene M | -- | Century Title Agency |
Source: Public Records
Mortgage History
| Date | Status | Borrower | Loan Amount |
|---|---|---|---|
| Open | Caballero Roberto | $15,000 |
Source: Public Records
Tax History Compared to Growth
Tax History
| Year | Tax Paid | Tax Assessment Tax Assessment Total Assessment is a certain percentage of the fair market value that is determined by local assessors to be the total taxable value of land and additions on the property. | Land | Improvement |
|---|---|---|---|---|
| 2025 | $2,037 | $14,184 | -- | -- |
| 2024 | $2,047 | $13,508 | -- | -- |
| 2023 | $2,047 | $29,430 | $5,880 | $23,550 |
| 2022 | $2,016 | $21,270 | $4,250 | $17,020 |
| 2021 | $2,035 | $19,360 | $3,870 | $15,490 |
| 2020 | $1,956 | $19,170 | $3,830 | $15,340 |
| 2019 | $1,932 | $16,780 | $3,350 | $13,430 |
| 2018 | $1,784 | $15,400 | $3,080 | $12,320 |
| 2017 | $1,761 | $12,800 | $2,560 | $10,240 |
| 2016 | $517 | $8,900 | $1,780 | $7,120 |
| 2015 | $489 | $7,570 | $1,510 | $6,060 |
Source: Public Records
Map
Nearby Homes
- 2148 W Campbell Ave
- 2148 W Hazelwood St
- 2133 W Turney Ave Unit D76
- 2133 W Turney Ave Unit C88
- 2040 W Hazelwood St
- 4325 N 21st Dr Unit 3
- 2132 W Glenrosa Ave Unit 81D
- 2377 W Hazelwood St
- 2349 W Campbell Ave
- 2019 W Turney Ave
- 2406 W Campbell Ave Unit 143
- 2412 W Campbell Ave Unit 318
- 2409 W Hazelwood St Unit 74
- 2105 W Elm St Unit 1
- 4701 N 23rd Dr
- 2107 W Glenrosa Ave
- 4714 N 23rd Ave
- 2118 W Elm St
- 4725 N 21st Ave
- 2423 W Campbell Ave
- 2143 W Minnezona Ave
- 2137 W Minnezona Ave
- 4520 N 22nd Ave
- 4510 N 22nd Ave
- 2142 W Campbell Ave
- 4506 N 22nd Ave
- 2148 W Minnezona Ave
- 2136 W Campbell Ave
- 2142 W Minnezona Ave
- 2131 W Minnezona Ave
- 2202 W Minnezona Ave
- 2204 W Campbell Ave Unit 2
- 2204 W Campbell Ave Unit 1
- 2136 W Minnezona Ave Unit 1
- 2209 W Minnezona Ave
- 2209 W Minnezona Ave Unit 1-6
- 2130 W Campbell Ave
- 2125 W Minnezona Ave
- 2130 W Minnezona Ave
- 2210 W Minnezona Ave