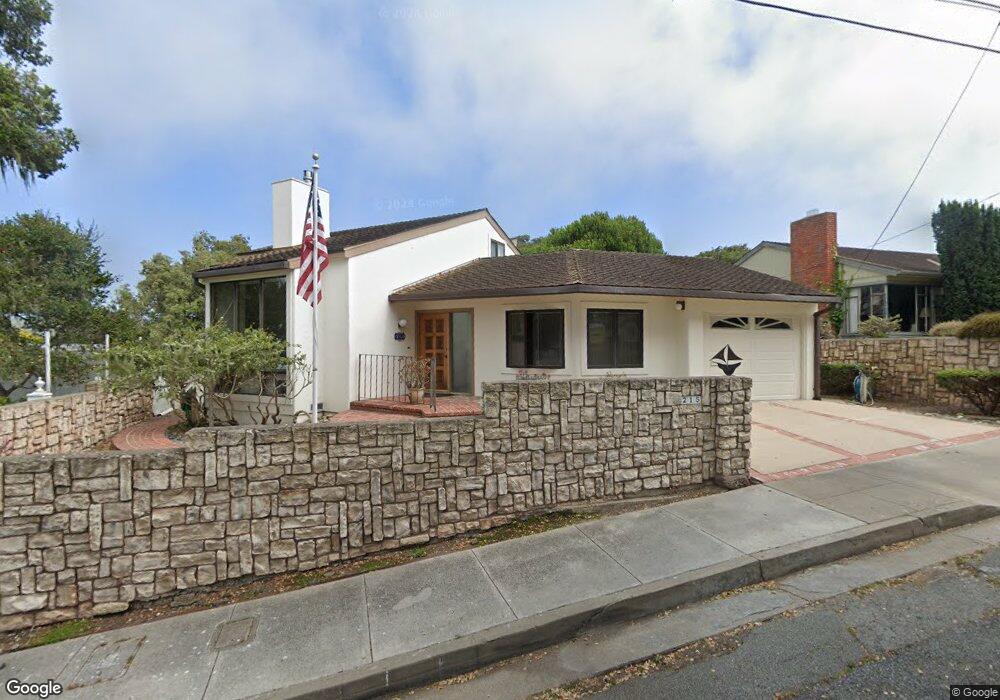
215 3rd St Pacific Grove, CA 93950
Estimated Value: $1,193,107 - $1,498,000
2
Beds
2
Baths
1,250
Sq Ft
$1,096/Sq Ft
Est. Value
About This Home
This home is located at 215 3rd St, Pacific Grove, CA 93950 and is currently estimated at $1,370,527, approximately $1,096 per square foot. 215 3rd St is a home located in Monterey County with nearby schools including Robert Down Elementary School, Pacific Grove Middle School, and Pacific Grove High School.
Ownership History
Date
Name
Owned For
Owner Type
Purchase Details
Closed on
Jan 2, 2019
Sold by
Savage Paul E and Savage Valeria F
Bought by
Fernandes Savage Paul Edward and Fernandes Savage Valeria
Current Estimated Value
Purchase Details
Closed on
Apr 9, 2013
Sold by
Savage Paul E
Bought by
Savage Pual E and Savage Valeria F
Purchase Details
Closed on
Feb 27, 2003
Sold by
Savage Edward G and Savage Lore S
Bought by
Savage Edward G and Savage Lore S
Purchase Details
Closed on
Jul 23, 1997
Sold by
Savage Edward G and Savage Lore S
Bought by
Savage Edward G and Savage Lore S
Purchase Details
Closed on
Dec 6, 1993
Sold by
Abichandani Krishin P and Abichandani Helen R
Bought by
Savage Edward G and Savage Lore S
Create a Home Valuation Report for This Property
The Home Valuation Report is an in-depth analysis detailing your home's value as well as a comparison with similar homes in the area
Home Values in the Area
Average Home Value in this Area
Purchase History
| Date | Buyer | Sale Price | Title Company |
|---|---|---|---|
| Fernandes Savage Paul Edward | -- | None Available | |
| Savage Pual E | -- | None Available | |
| Savage Edward G | -- | -- | |
| Savage Edward G | -- | -- | |
| Savage Edward G | $205,000 | Chicago Title Company |
Source: Public Records
Tax History Compared to Growth
Tax History
| Year | Tax Paid | Tax Assessment Tax Assessment Total Assessment is a certain percentage of the fair market value that is determined by local assessors to be the total taxable value of land and additions on the property. | Land | Improvement |
|---|---|---|---|---|
| 2025 | $5,357 | $509,868 | $305,923 | $203,945 |
| 2024 | $5,357 | $499,872 | $299,925 | $199,947 |
| 2023 | $5,454 | $490,072 | $294,045 | $196,027 |
| 2022 | $5,344 | $480,464 | $288,280 | $192,184 |
| 2021 | $5,317 | $471,044 | $282,628 | $188,416 |
| 2020 | $5,211 | $466,215 | $279,730 | $186,485 |
| 2019 | $5,047 | $457,075 | $274,246 | $182,829 |
| 2018 | $4,948 | $448,114 | $268,869 | $179,245 |
| 2017 | $4,868 | $439,329 | $263,598 | $175,731 |
| 2016 | $4,879 | $430,716 | $258,430 | $172,286 |
| 2015 | $4,801 | $424,248 | $254,549 | $169,699 |
| 2014 | $4,701 | $415,938 | $249,563 | $166,375 |
Source: Public Records
Map
Nearby Homes