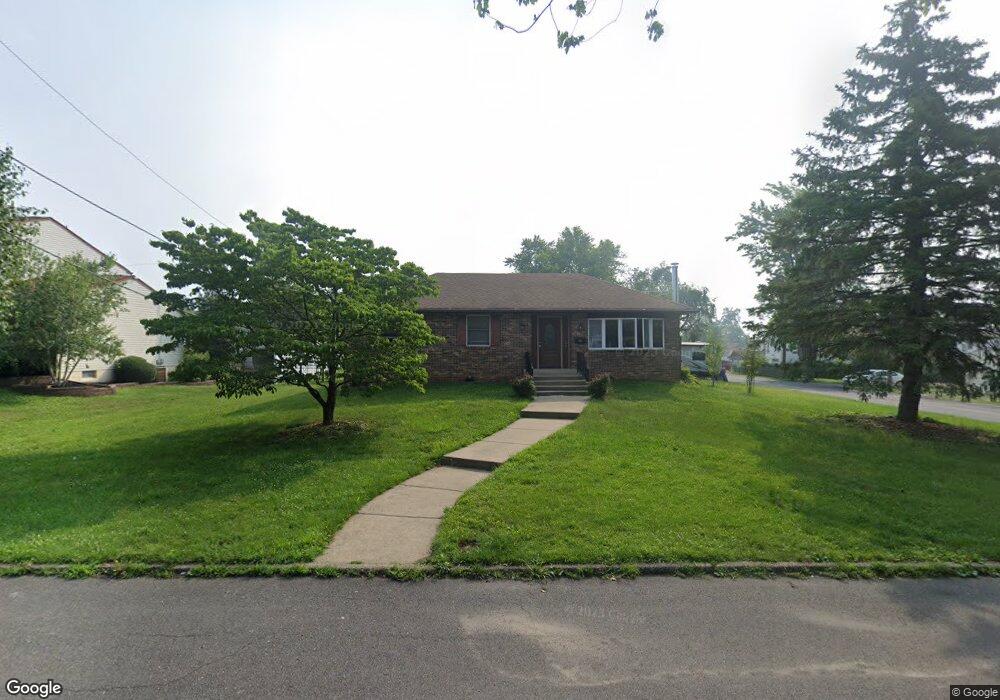
215 Cambria Ave Bensalem, PA 19020
Estimated Value: $386,000 - $490,727
3
Beds
2
Baths
1,250
Sq Ft
$354/Sq Ft
Est. Value
About This Home
This home is located at 215 Cambria Ave, Bensalem, PA 19020 and is currently estimated at $441,932, approximately $353 per square foot. 215 Cambria Ave is a home located in Bucks County with nearby schools including Robert K. Shafer Middle School, School Lane Charter School, and St Charles Borromeo School.
Ownership History
Date
Name
Owned For
Owner Type
Purchase Details
Closed on
Dec 5, 2022
Sold by
Fields James P
Bought by
Fankhouser Jewelia M and Crews Ralph C
Current Estimated Value
Home Financials for this Owner
Home Financials are based on the most recent Mortgage that was taken out on this home.
Original Mortgage
$333,841
Outstanding Balance
$323,823
Interest Rate
6.95%
Mortgage Type
FHA
Estimated Equity
$118,109
Purchase Details
Closed on
Jun 17, 2016
Sold by
Logan Janet A
Bought by
Fields James P
Home Financials for this Owner
Home Financials are based on the most recent Mortgage that was taken out on this home.
Original Mortgage
$185,948
Interest Rate
3.25%
Mortgage Type
FHA
Purchase Details
Closed on
Jun 23, 2014
Sold by
Filds Walter J and Fields Anna T
Bought by
Fields Walter J
Purchase Details
Closed on
Aug 15, 1979
Bought by
Fields Walter J and Fields Anna T
Create a Home Valuation Report for This Property
The Home Valuation Report is an in-depth analysis detailing your home's value as well as a comparison with similar homes in the area
Home Values in the Area
Average Home Value in this Area
Purchase History
| Date | Buyer | Sale Price | Title Company |
|---|---|---|---|
| Fankhouser Jewelia M | $340,000 | Surety Expert Abstract | |
| Fields James P | $215,000 | Iabstract & Title Agency Llc | |
| Fields Walter J | -- | None Available | |
| Fields Walter J | $12,000 | -- |
Source: Public Records
Mortgage History
| Date | Status | Borrower | Loan Amount |
|---|---|---|---|
| Open | Fankhouser Jewelia M | $333,841 | |
| Previous Owner | Fields James P | $185,948 |
Source: Public Records
Tax History Compared to Growth
Tax History
| Year | Tax Paid | Tax Assessment Tax Assessment Total Assessment is a certain percentage of the fair market value that is determined by local assessors to be the total taxable value of land and additions on the property. | Land | Improvement |
|---|---|---|---|---|
| 2025 | $4,453 | $20,400 | $2,680 | $17,720 |
| 2024 | $4,453 | $20,400 | $2,680 | $17,720 |
| 2023 | $4,328 | $20,400 | $2,680 | $17,720 |
| 2022 | $4,302 | $20,400 | $2,680 | $17,720 |
| 2021 | $4,302 | $20,400 | $2,680 | $17,720 |
| 2020 | $4,259 | $20,400 | $2,680 | $17,720 |
| 2019 | $4,164 | $20,400 | $2,680 | $17,720 |
| 2018 | $4,068 | $20,400 | $2,680 | $17,720 |
| 2017 | $4,042 | $20,400 | $2,680 | $17,720 |
| 2016 | $4,042 | $20,400 | $2,680 | $17,720 |
| 2015 | -- | $20,400 | $2,680 | $17,720 |
| 2014 | -- | $20,400 | $2,680 | $17,720 |
Source: Public Records
Map
Nearby Homes
- 2025 State Rd
- 106 Dock St
- 126B Royal Mews
- 113 Royal Mews
- 106A Prince George St Unit A
- 120B Dock St
- 136b Alexandria St
- 97 Waterside Mews
- 116B King St
- 114B King St
- 104B King St
- 204A Dock St
- 7 Fox Ct Unit EE7
- 44 River Ln Unit HH44
- 10 Fawn Ct Unit Z10
- 2 Teal Ct Unit X2
- 833 Simons Ave
- 2209 Dungan Ave
- 943 Cornwells Ave
- 1606 Rivers Edge Dr