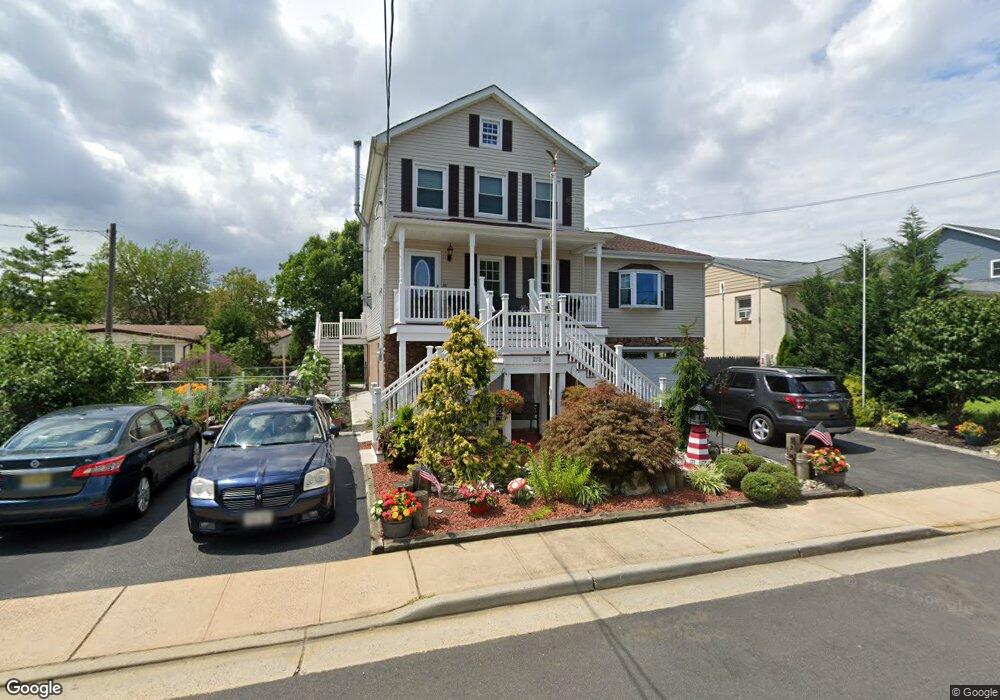
215 Dock St Union Beach, NJ 07735
Estimated Value: $599,162 - $693,000
4
Beds
3
Baths
2,588
Sq Ft
$248/Sq Ft
Est. Value
About This Home
This home is located at 215 Dock St, Union Beach, NJ 07735 and is currently estimated at $642,041, approximately $248 per square foot. 215 Dock St is a home located in Monmouth County with nearby schools including Memorial School and Baytul-Iman Academy.
Ownership History
Date
Name
Owned For
Owner Type
Purchase Details
Closed on
Aug 5, 1994
Sold by
Moramarco Patrice
Bought by
Hagman Winslow and Hagman Vickie
Current Estimated Value
Home Financials for this Owner
Home Financials are based on the most recent Mortgage that was taken out on this home.
Original Mortgage
$129,000
Interest Rate
8.4%
Mortgage Type
FHA
Purchase Details
Closed on
Oct 7, 1993
Sold by
The Prudential Home
Bought by
Moramarco Patrice
Create a Home Valuation Report for This Property
The Home Valuation Report is an in-depth analysis detailing your home's value as well as a comparison with similar homes in the area
Home Values in the Area
Average Home Value in this Area
Purchase History
| Date | Buyer | Sale Price | Title Company |
|---|---|---|---|
| Hagman Winslow | $134,000 | -- | |
| Moramarco Patrice | $40,000 | -- |
Source: Public Records
Mortgage History
| Date | Status | Borrower | Loan Amount |
|---|---|---|---|
| Closed | Hagman Winslow | $129,000 |
Source: Public Records
Tax History Compared to Growth
Tax History
| Year | Tax Paid | Tax Assessment Tax Assessment Total Assessment is a certain percentage of the fair market value that is determined by local assessors to be the total taxable value of land and additions on the property. | Land | Improvement |
|---|---|---|---|---|
| 2025 | $10,399 | $551,200 | $244,100 | $307,100 |
| 2024 | $9,202 | $504,300 | $212,200 | $292,100 |
| 2023 | $9,202 | $430,000 | $165,100 | $264,900 |
| 2022 | $8,347 | $389,300 | $132,000 | $257,300 |
| 2021 | $8,347 | $340,000 | $120,100 | $219,900 |
| 2020 | $8,315 | $330,500 | $115,400 | $215,100 |
| 2019 | $8,124 | $315,000 | $109,900 | $205,100 |
| 2018 | $8,183 | $305,000 | $99,000 | $206,000 |
| 2017 | $7,312 | $262,000 | $91,000 | $171,000 |
| 2016 | $6,816 | $244,400 | $81,800 | $162,600 |
| 2015 | $6,689 | $244,200 | $89,000 | $155,200 |
| 2014 | $6,793 | $204,500 | $79,000 | $125,500 |
Source: Public Records
Map
Nearby Homes
- 342 Front St
- 814 5th St
- 417 Pine St
- 538 Front St
- 605 Spruce St
- 934 7th St
- 902 10th St
- 1009 Edmunds Ave
- 425 Bayview Ave
- 1 Campbell St
- 401 Spruce St
- 1242 Florence Ave
- 1246 Florence Ave
- 535 Lorillard Ave
- 120 Victoria Place
- 819 Saint John's Ave
- 725 Prospect Ave
- 412 Union Ave
- 709 Lorillard Ave
- 521 Columbia Ave