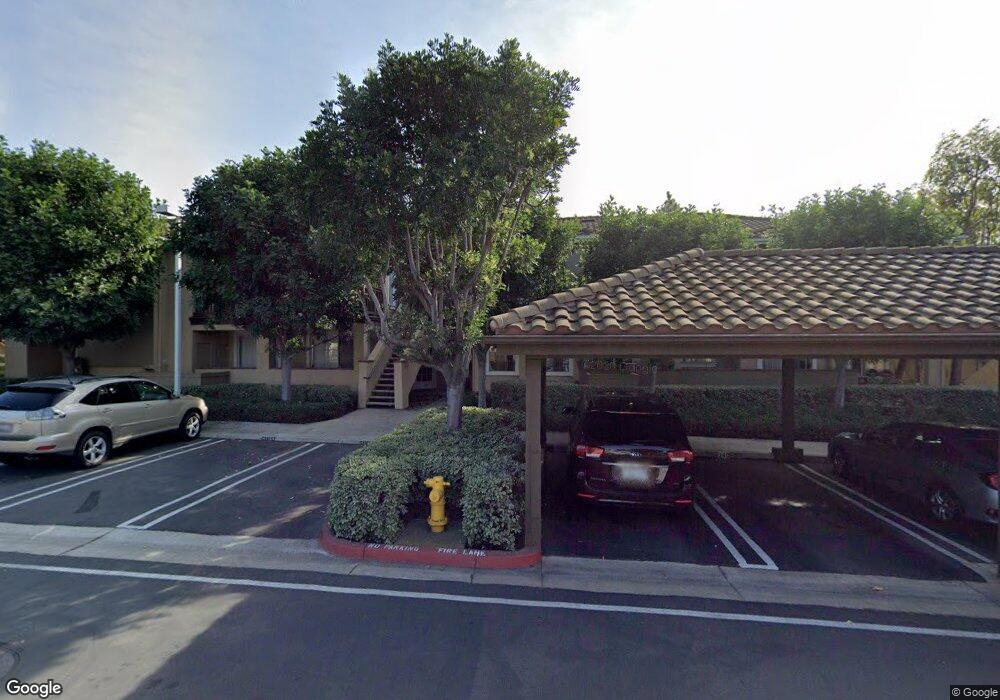
215 Gallery Way Unit 145 Tustin, CA 92782
Tustin Ranch NeighborhoodEstimated Value: $776,000 - $863,000
2
Beds
2
Baths
1,154
Sq Ft
$701/Sq Ft
Est. Value
About This Home
This home is located at 215 Gallery Way Unit 145, Tustin, CA 92782 and is currently estimated at $808,553, approximately $700 per square foot. 215 Gallery Way Unit 145 is a home located in Orange County with nearby schools including Ladera Elementary School, Pioneer Middle School, and Arnold O. Beckman High School.
Ownership History
Date
Name
Owned For
Owner Type
Purchase Details
Closed on
Aug 13, 2021
Sold by
Pattee Susan D
Bought by
Pattee Susan D and Susan D Pattee Trust
Current Estimated Value
Purchase Details
Closed on
Nov 20, 2001
Sold by
Beidler Eva Jo
Bought by
Pattee Susan D
Home Financials for this Owner
Home Financials are based on the most recent Mortgage that was taken out on this home.
Original Mortgage
$151,700
Outstanding Balance
$58,898
Interest Rate
6.63%
Estimated Equity
$749,655
Purchase Details
Closed on
Jun 29, 2000
Sold by
Vail Michael S and Vail Monalee
Bought by
Pattee Susan and Beidler Eva Jo
Home Financials for this Owner
Home Financials are based on the most recent Mortgage that was taken out on this home.
Original Mortgage
$149,250
Interest Rate
8.2%
Create a Home Valuation Report for This Property
The Home Valuation Report is an in-depth analysis detailing your home's value as well as a comparison with similar homes in the area
Home Values in the Area
Average Home Value in this Area
Purchase History
| Date | Buyer | Sale Price | Title Company |
|---|---|---|---|
| Pattee Susan D | -- | None Available | |
| Pattee Susan D | -- | Benefit Land Title Company | |
| Pattee Susan | $199,000 | Orange Coast Title |
Source: Public Records
Mortgage History
| Date | Status | Borrower | Loan Amount |
|---|---|---|---|
| Open | Pattee Susan D | $151,700 | |
| Closed | Pattee Susan | $149,250 |
Source: Public Records
Tax History Compared to Growth
Tax History
| Year | Tax Paid | Tax Assessment Tax Assessment Total Assessment is a certain percentage of the fair market value that is determined by local assessors to be the total taxable value of land and additions on the property. | Land | Improvement |
|---|---|---|---|---|
| 2025 | $3,072 | $299,854 | $158,061 | $141,793 |
| 2024 | $3,072 | $293,975 | $154,962 | $139,013 |
| 2023 | $3,000 | $288,211 | $151,923 | $136,288 |
| 2022 | $3,397 | $282,560 | $148,944 | $133,616 |
| 2021 | $3,318 | $277,020 | $146,023 | $130,997 |
| 2020 | $3,268 | $274,180 | $144,526 | $129,654 |
| 2019 | $3,204 | $268,804 | $141,692 | $127,112 |
| 2018 | $3,132 | $263,534 | $138,914 | $124,620 |
| 2017 | $3,035 | $258,367 | $136,190 | $122,177 |
| 2016 | $2,979 | $253,301 | $133,519 | $119,782 |
| 2015 | $2,948 | $249,497 | $131,514 | $117,983 |
| 2014 | $2,916 | $244,610 | $128,938 | $115,672 |
Source: Public Records
Map
Nearby Homes
- 12095 Morrow Dr
- 2495 Tequestra
- 2605 Augusta
- 12257 Pevero
- 2960 Champion Way Unit 1208
- 2960 Champion Way Unit 1814
- 11755 Collar Ave
- 12215 Wyne Ct
- 2827 Player Ln
- 2346 Tryall Unit 78
- 204 Briar Ln
- 205 Briar Ln
- 201 Briar Ln
- 15 Ardmore Unit 117
- 10 Calais
- 12261 Browning Ave
- 12709 Trent Jones Ln
- 12605 Prescott Ave
- 12665 Stanton Ave
- 33 Winterfield Rd
- 209 Gallery Way Unit 140
- 216 Gallery Way
- 204 Gallery Way
- 203 Gallery Way
- 212 Gallery Way Unit 142
- 209 Gallery Way
- 201 Gallery Way
- 198 Gallery Way
- 210 Gallery Way
- 170 Gallery Way
- 173 Gallery Way
- 181 Gallery Way
- 195 Gallery Way
- 202 Gallery Way
- 206 Gallery Way
- 205 Gallery Way
- 169 Gallery Way
- 213 Gallery Way
- 192 Gallery Way
- 168 Gallery Way