
Seller's Agent in 2025
Susan Eagle
DANIEL CRAPPS AGENCY, INC
(386) 755-5110
22 in this area
86 Total Sales

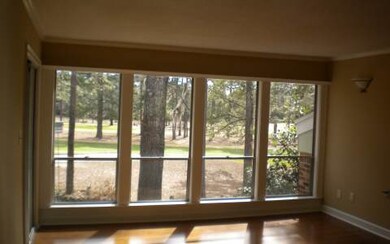


2/2 Condo in Lake City that has been completely remodeled. It comes with a newer kitchen, newer wood and carpet flooring. The bathrooms has been remodeled with newer fixtures. HOA is 293 per month, which includes swimming pool, tennis court, exterior maintenance, water, sewer, basic cable and landscape. Condo comes with a great view of the golf course.
Home Type
Est. Annual Taxes
Year Built
Parking
Home Design
Interior Spaces
Kitchen
Flooring
Bedrooms and Bathrooms
Utilities
Additional Features
Overview
Recreation
| Date | Type | Sale Price | Title Company |
|---|---|---|---|
| Warranty Deed | $154,000 | Abstract Trust Title | |
| Warranty Deed | -- | -- |
| Date | Event | Price | Change | Sq Ft Price |
|---|---|---|---|---|
| 07/07/2025 07/07/25 | Sold | $175,000 | 0.0% | $138 / Sq Ft |
| 06/18/2025 06/18/25 | Price Changed | $2,200 | -12.0% | $1 / Sq Ft |
| 06/17/2025 06/17/25 | For Rent | $2,500 | 0.0% | -- |
| 06/12/2025 06/12/25 | Pending | -- | -- | -- |
| 05/28/2025 05/28/25 | Price Changed | $239,995 | 0.0% | $124 / Sq Ft |
| 05/28/2025 05/28/25 | For Sale | $239,995 | -1.9% | $124 / Sq Ft |
| 05/16/2025 05/16/25 | Off Market | $244,693 | -- | -- |
| 04/29/2025 04/29/25 | For Sale | $185,000 | -28.6% | $146 / Sq Ft |
| 01/29/2025 01/29/25 | For Sale | $259,000 | +5.8% | $156 / Sq Ft |
| 11/21/2024 11/21/24 | For Sale | $244,693 | +23.3% | $126 / Sq Ft |
| 03/14/2024 03/14/24 | Sold | $198,500 | 0.0% | $126 / Sq Ft |
| 02/13/2024 02/13/24 | Pending | -- | -- | -- |
| 11/08/2023 11/08/23 | For Sale | $198,500 | 0.0% | $126 / Sq Ft |
| 04/01/2023 04/01/23 | Rented | -- | -- | -- |
| 04/01/2023 04/01/23 | For Rent | $1,800 | -98.8% | -- |
| 11/03/2022 11/03/22 | Rented | -- | -- | -- |
| 10/21/2022 10/21/22 | Sold | $145,000 | 0.0% | $92 / Sq Ft |
| 10/11/2022 10/11/22 | For Rent | $1,950 | 0.0% | -- |
| 09/22/2022 09/22/22 | Off Market | $145,000 | -- | -- |
| 09/16/2022 09/16/22 | Price Changed | $164,999 | -6.8% | $104 / Sq Ft |
| 09/15/2022 09/15/22 | Sold | $177,000 | 0.0% | $138 / Sq Ft |
| 08/16/2022 08/16/22 | Pending | -- | -- | -- |
| 08/14/2022 08/14/22 | For Sale | $177,000 | +1.1% | $138 / Sq Ft |
| 07/20/2022 07/20/22 | For Sale | $174,999 | +38.9% | $111 / Sq Ft |
| 03/25/2022 03/25/22 | Sold | $126,000 | 0.0% | $99 / Sq Ft |
| 02/23/2022 02/23/22 | Pending | -- | -- | -- |
| 02/10/2022 02/10/22 | Rented | -- | -- | -- |
| 02/10/2022 02/10/22 | For Rent | -- | -- | -- |
| 02/10/2022 02/10/22 | For Sale | $126,000 | -18.7% | $99 / Sq Ft |
| 12/24/2021 12/24/21 | Sold | $155,000 | +10.7% | $91 / Sq Ft |
| 11/24/2021 11/24/21 | Pending | -- | -- | -- |
| 06/30/2021 06/30/21 | Sold | $140,000 | -9.7% | $83 / Sq Ft |
| 05/31/2021 05/31/21 | Pending | -- | -- | -- |
| 05/17/2021 05/17/21 | For Sale | $155,000 | +10.7% | $91 / Sq Ft |
| 04/17/2021 04/17/21 | For Sale | $140,000 | +21.7% | $83 / Sq Ft |
| 02/26/2021 02/26/21 | Sold | $115,000 | 0.0% | $81 / Sq Ft |
| 01/27/2021 01/27/21 | Pending | -- | -- | -- |
| 12/29/2020 12/29/20 | For Sale | $115,000 | -10.9% | $81 / Sq Ft |
| 12/10/2020 12/10/20 | Sold | $129,000 | +12.2% | $70 / Sq Ft |
| 11/25/2020 11/25/20 | Sold | $115,000 | -10.9% | $90 / Sq Ft |
| 11/10/2020 11/10/20 | Pending | -- | -- | -- |
| 11/02/2020 11/02/20 | For Sale | $129,000 | 0.0% | $70 / Sq Ft |
| 06/17/2020 06/17/20 | Rented | -- | -- | -- |
| 06/17/2020 06/17/20 | For Rent | -- | -- | -- |
| 09/06/2019 09/06/19 | Sold | $95,000 | -20.8% | $56 / Sq Ft |
| 08/29/2019 08/29/19 | Sold | $120,000 | 0.0% | $68 / Sq Ft |
| 08/19/2019 08/19/19 | Rented | -- | -- | -- |
| 08/19/2019 08/19/19 | For Rent | -- | -- | -- |
| 08/10/2019 08/10/19 | For Sale | $95,000 | -20.8% | $56 / Sq Ft |
| 07/30/2019 07/30/19 | Pending | -- | -- | -- |
| 07/08/2019 07/08/19 | For Sale | $120,000 | 0.0% | $68 / Sq Ft |
| 02/01/2019 02/01/19 | Rented | -- | -- | -- |
| 02/01/2019 02/01/19 | For Rent | -- | -- | -- |
| 08/01/2018 08/01/18 | Rented | -- | -- | -- |
| 08/01/2018 08/01/18 | For Rent | -- | -- | -- |
| 01/15/2018 01/15/18 | Rented | -- | -- | -- |
| 01/15/2018 01/15/18 | For Rent | -- | -- | -- |
| 10/30/2017 10/30/17 | Rented | -- | -- | -- |
| 09/30/2017 09/30/17 | Under Contract | -- | -- | -- |
| 08/01/2017 08/01/17 | For Rent | -- | -- | -- |
| 02/01/2017 02/01/17 | Rented | -- | -- | -- |
| 02/01/2017 02/01/17 | For Rent | -- | -- | -- |
| 10/20/2016 10/20/16 | Sold | $102,000 | 0.0% | $62 / Sq Ft |
| 09/20/2016 09/20/16 | Pending | -- | -- | -- |
| 08/26/2016 08/26/16 | For Sale | $102,000 | 0.0% | $62 / Sq Ft |
| 07/27/2016 07/27/16 | Rented | -- | -- | -- |
| 06/27/2016 06/27/16 | Under Contract | -- | -- | -- |
| 06/17/2016 06/17/16 | For Rent | -- | -- | -- |
| 11/05/2015 11/05/15 | Sold | $105,000 | 0.0% | $54 / Sq Ft |
| 10/30/2015 10/30/15 | For Sale | $105,000 | +22.1% | $54 / Sq Ft |
| 07/31/2015 07/31/15 | Sold | $86,000 | 0.0% | $51 / Sq Ft |
| 07/09/2015 07/09/15 | For Sale | $86,000 | 0.0% | $51 / Sq Ft |
| 04/29/2015 04/29/15 | Rented | -- | -- | -- |
| 04/20/2015 04/20/15 | Sold | $99,000 | 0.0% | $54 / Sq Ft |
| 04/17/2015 04/17/15 | Rented | -- | -- | -- |
| 04/17/2015 04/17/15 | For Rent | -- | -- | -- |
| 04/01/2015 04/01/15 | Rented | -- | -- | -- |
| 04/01/2015 04/01/15 | For Rent | -- | -- | -- |
| 03/30/2015 03/30/15 | Under Contract | -- | -- | -- |
| 03/21/2015 03/21/15 | Pending | -- | -- | -- |
| 06/07/2014 06/07/14 | For Sale | $99,000 | 0.0% | $54 / Sq Ft |
| 06/01/2014 06/01/14 | For Rent | -- | -- | -- |
| 04/24/2014 04/24/14 | Sold | $85,000 | 0.0% | $66 / Sq Ft |
| 03/25/2014 03/25/14 | Pending | -- | -- | -- |
| 03/12/2014 03/12/14 | For Sale | $85,000 | 0.0% | $66 / Sq Ft |
| 01/07/2014 01/07/14 | Rented | -- | -- | -- |
| 12/08/2013 12/08/13 | Under Contract | -- | -- | -- |
| 10/01/2013 10/01/13 | For Rent | -- | -- | -- |
| 09/27/2012 09/27/12 | Sold | $87,000 | 0.0% | $68 / Sq Ft |
| 08/31/2012 08/31/12 | For Sale | $87,000 | -- | $68 / Sq Ft |
| Year | Tax Paid | Tax Assessment Tax Assessment Total Assessment is a certain percentage of the fair market value that is determined by local assessors to be the total taxable value of land and additions on the property. | Land | Improvement |
|---|---|---|---|---|
| 2024 | $1,171 | $121,391 | -- | -- |
| 2023 | $1,171 | $114,534 | $0 | $0 |
| 2022 | $738 | $82,931 | $0 | $0 |
| 2021 | $700 | $80,516 | $0 | $0 |
| 2020 | $698 | $79,404 | $10 | $79,394 |
| 2019 | $740 | $79,554 | $10 | $79,544 |
| 2018 | $774 | $80,926 | $10 | $80,916 |
| 2017 | $761 | $79,726 | $10 | $79,716 |
| 2016 | $727 | $80,401 | $10 | $80,391 |
| 2015 | $736 | $78,901 | $0 | $0 |
| 2014 | $728 | $78,275 | $0 | $0 |
Seller's Agent in 2025
Susan Eagle
DANIEL CRAPPS AGENCY, INC
(386) 755-5110
22 in this area
86 Total Sales
Seller's Agent in 2025
Daniel Crapps
DANIEL CRAPPS AGENCY, INC
(386) 397-3002
90 in this area
341 Total Sales
Seller's Agent in 2025
Missy Zecher
RE/MAX
(386) 752-8653
265 in this area
853 Total Sales
A
Buyer's Agent in 2025
Abby Hale
BLUE SKIES REALTY BOUTIQUE LLC
(386) 344-7535
2 in this area
6 Total Sales
S
Seller's Agent in 2024
Stan Batten
STAN BATTEN REAL ESTATE, INC.
(386) 961-1475
31 in this area
98 Total Sales
C
Seller's Agent in 2024
Charles Kalb
ROCKFORD REALTY GROUP INC
(386) 867-5081
5 Total Sales
Source: North Florida MLS
MLS Number: 81255
APN: 27-3S-16-02312-014
Disclaimer: Certain information contained herein is derived from information provided by parties other than Homes.com. All information provided is deemed reliable, but is not guaranteed to be accurate and should be independently verified.
![]() IDX information is provided exclusively for personal, non-commercial use, and may not be used for any purpose other than to identify prospective properties consumers may be interested in purchasing. Information is deemed reliable but not guaranteed.
IDX information is provided exclusively for personal, non-commercial use, and may not be used for any purpose other than to identify prospective properties consumers may be interested in purchasing. Information is deemed reliable but not guaranteed.