Estimated Value: $205,000 - $284,000
3
Beds
1
Bath
1,144
Sq Ft
$202/Sq Ft
Est. Value
About This Home
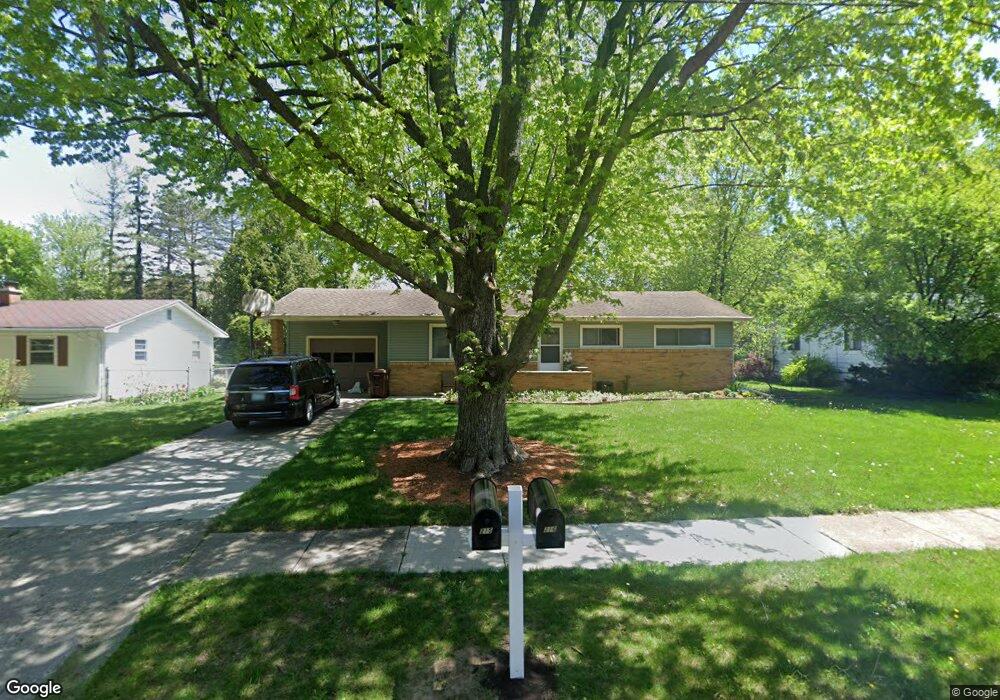
This home is located at 215 Stevens St, Mason, MI 48854 and is currently estimated at $231,422, approximately $202 per square foot. 215 Stevens St is a home located in Ingham County with nearby schools including Mason High School.
Ownership History
Date
Name
Owned For
Owner Type
Purchase Details
Closed on
Oct 15, 2018
Sold by
Reeder Angela M
Bought by
The Angela M Reeder Revocable Living Tru
Current Estimated Value
Purchase Details
Closed on
Nov 7, 2014
Sold by
Gibson Virginia K
Bought by
Reeder Angela M
Home Financials for this Owner
Home Financials are based on the most recent Mortgage that was taken out on this home.
Original Mortgage
$132,653
Outstanding Balance
$102,324
Interest Rate
4.19%
Mortgage Type
New Conventional
Estimated Equity
$129,098
Purchase Details
Closed on
Jan 11, 2002
Sold by
Miller Ronald D and Miller Nora M
Bought by
Gibson Virginia K
Home Financials for this Owner
Home Financials are based on the most recent Mortgage that was taken out on this home.
Original Mortgage
$78,000
Interest Rate
7.16%
Mortgage Type
Purchase Money Mortgage
Create a Home Valuation Report for This Property
The Home Valuation Report is an in-depth analysis detailing your home's value as well as a comparison with similar homes in the area
Home Values in the Area
Average Home Value in this Area
Purchase History
| Date | Buyer | Sale Price | Title Company |
|---|---|---|---|
| The Angela M Reeder Revocable Living Tru | -- | None Available | |
| Reeder Angela M | $130,000 | None Available | |
| Gibson Virginia K | $128,000 | -- |
Source: Public Records
Mortgage History
| Date | Status | Borrower | Loan Amount |
|---|---|---|---|
| Open | Reeder Angela M | $132,653 | |
| Previous Owner | Gibson Virginia K | $78,000 |
Source: Public Records
Tax History Compared to Growth
Tax History
| Year | Tax Paid | Tax Assessment Tax Assessment Total Assessment is a certain percentage of the fair market value that is determined by local assessors to be the total taxable value of land and additions on the property. | Land | Improvement |
|---|---|---|---|---|
| 2025 | $3,461 | $90,570 | $29,350 | $61,220 |
| 2024 | $26 | $85,070 | $29,350 | $55,720 |
| 2023 | $3,257 | $83,200 | $27,030 | $56,170 |
| 2022 | $3,107 | $75,380 | $27,470 | $47,910 |
| 2021 | $3,043 | $72,640 | $27,470 | $45,170 |
| 2020 | $2,926 | $65,980 | $27,470 | $38,510 |
| 2019 | $2,831 | $62,100 | $21,590 | $40,510 |
| 2018 | $2,780 | $62,430 | $19,620 | $42,810 |
| 2017 | $2,523 | $62,430 | $19,620 | $42,810 |
| 2016 | -- | $53,820 | $10,200 | $43,620 |
| 2015 | -- | $48,630 | $20,409 | $28,221 |
| 2014 | -- | $50,120 | $33,360 | $16,760 |
Source: Public Records
Map
Nearby Homes
- 117 Lawton St
- 202 Stratford Dr
- 327 Steele St
- 427 E Ash St
- 416 E Elm St
- 317 E Elm St
- 0 Sanctuary
- 32 Aviemore Dr Unit 32
- 116 E Elm St
- 833 S Barnes St
- 443 W Ash St
- 209 Peachtree Place
- 990 Windjammer Ct
- 411 Bubbling Springs Ct
- 1470 N Cedar St
- 318 Ives Rd
- 105 Carom Cir
- 902 Eagles Nest Ct
- 311 Carom Cir
- 915 Carom Cir