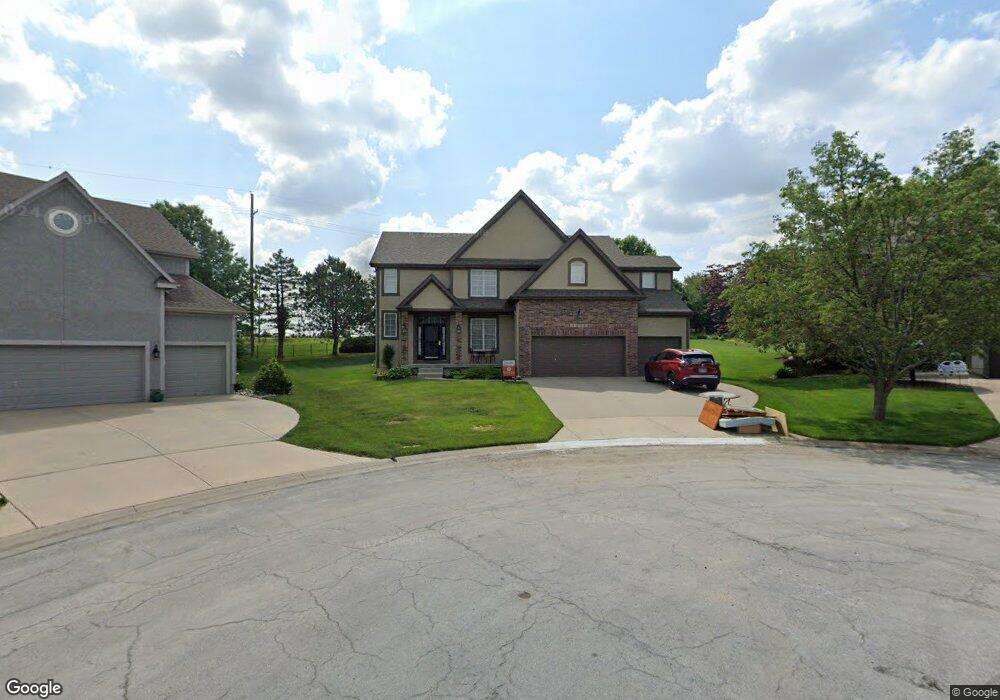
21503 W 99th Terrace Lenexa, KS 66220
Estimated Value: $591,000 - $636,743
4
Beds
5
Baths
2,596
Sq Ft
$235/Sq Ft
Est. Value
About This Home
This home is located at 21503 W 99th Terrace, Lenexa, KS 66220 and is currently estimated at $609,936, approximately $234 per square foot. 21503 W 99th Terrace is a home located in Johnson County with nearby schools including Manchester Park Elementary School, Prairie Trail Middle School, and Olathe Northwest High School.
Ownership History
Date
Name
Owned For
Owner Type
Purchase Details
Closed on
Jun 7, 2023
Sold by
Self Gregory L and Self Kelly J
Bought by
Birkett Thomas J and Birkett Kathy M
Current Estimated Value
Purchase Details
Closed on
Jan 30, 2003
Sold by
Self Gregory L and Self Kelly J
Bought by
Self Gregory L and Self Kelly J
Home Financials for this Owner
Home Financials are based on the most recent Mortgage that was taken out on this home.
Original Mortgage
$213,350
Interest Rate
5.9%
Purchase Details
Closed on
Feb 13, 2002
Sold by
J S Robinson Construction Inc
Bought by
Self Greg L and Self Kelly J
Home Financials for this Owner
Home Financials are based on the most recent Mortgage that was taken out on this home.
Original Mortgage
$213,350
Interest Rate
7.19%
Purchase Details
Closed on
Nov 12, 2001
Sold by
Manchester Partners Llc
Bought by
J S Robinson Construction Inc
Create a Home Valuation Report for This Property
The Home Valuation Report is an in-depth analysis detailing your home's value as well as a comparison with similar homes in the area
Home Values in the Area
Average Home Value in this Area
Purchase History
| Date | Buyer | Sale Price | Title Company |
|---|---|---|---|
| Birkett Thomas J | -- | Security 1St Title | |
| Self Gregory L | -- | Assured Quality Title Co | |
| Self Greg L | -- | Security Land Title Company | |
| J S Robinson Construction Inc | -- | Security Land Title Company |
Source: Public Records
Mortgage History
| Date | Status | Borrower | Loan Amount |
|---|---|---|---|
| Previous Owner | Self Gregory L | $213,350 | |
| Previous Owner | Self Greg L | $213,350 | |
| Closed | Self Greg L | $26,672 |
Source: Public Records
Tax History Compared to Growth
Tax History
| Year | Tax Paid | Tax Assessment Tax Assessment Total Assessment is a certain percentage of the fair market value that is determined by local assessors to be the total taxable value of land and additions on the property. | Land | Improvement |
|---|---|---|---|---|
| 2024 | $7,457 | $60,662 | $12,436 | $48,226 |
| 2023 | $6,411 | $51,198 | $11,852 | $39,346 |
| 2022 | $6,047 | $47,093 | $10,779 | $36,314 |
| 2021 | $5,662 | $41,906 | $10,271 | $31,635 |
| 2020 | $5,612 | $41,136 | $10,271 | $30,865 |
| 2019 | $5,515 | $40,123 | $8,926 | $31,197 |
| 2018 | $5,125 | $36,846 | $8,926 | $27,920 |
| 2017 | $4,992 | $35,109 | $7,139 | $27,970 |
| 2016 | $4,676 | $33,615 | $7,620 | $25,995 |
| 2015 | $4,716 | $33,925 | $7,620 | $26,305 |
| 2013 | -- | $31,832 | $7,620 | $24,212 |
Source: Public Records
Map
Nearby Homes
- 21522 W 98th Terrace
- 21901 W 99th Terrace
- 22005 W 99th Terrace
- 22077 W 99th Terrace
- 22017 W 99th Terrace
- 22029 W 99th Terrace
- 22076 W 99th Terrace
- 21913 W 99th Terrace
- 10041 Aurora St
- 21925 W 99th Terrace
- 10026 Aurora St
- 21926 W 99th Terrace
- 21938 W 99th Terrace
- 22064 W 99th Terrace
- 22051 W 100th Terrace
- 22063 W 100th Terrace
- 22087 W 100th Terrace
- 10206 Theden Cir
- 9927 Brockway St
- 9950 Brockway St
- 21503 W 99 Terrace
- 21507 W 99th Terrace
- 21502 W 99th Terrace
- 21500 W 100th St
- 21504 W 100th St
- 21511 W 99th Terrace
- 21506 W 99th Terrace
- 21508 W 100th St
- 21510 W 99th Terrace
- 21515 W 99th Terrace
- 21501 W 100th St
- 21514 W 99th Terrace
- 21512 W 100th St
- 21513 W 99th St
- 21601 W 99th Terrace
- 21518 W 99th Terrace
- 21518 W 99th Terrace
- 21517 W 99th St
- 21505 W 100th St
- 21509 W 100th St