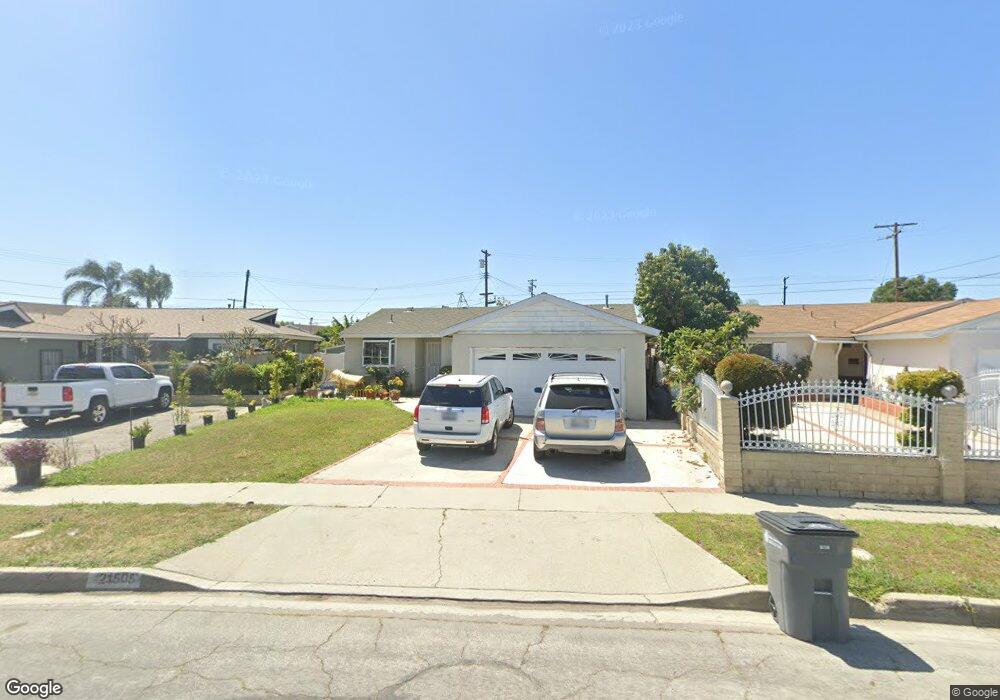
21505 Nicolle Ave Carson, CA 90745
Estimated Value: $677,029 - $707,000
4
Beds
2
Baths
1,118
Sq Ft
$623/Sq Ft
Est. Value
About This Home
This home is located at 21505 Nicolle Ave, Carson, CA 90745 and is currently estimated at $696,007, approximately $622 per square foot. 21505 Nicolle Ave is a home located in Los Angeles County with nearby schools including Carson Street Elementary School, Stephen M. White Middle School, and Carson High School.
Ownership History
Date
Name
Owned For
Owner Type
Purchase Details
Closed on
Jun 1, 1999
Sold by
Shansey Josephine M and Drew Josephine M
Bought by
Drew Josephine M
Current Estimated Value
Home Financials for this Owner
Home Financials are based on the most recent Mortgage that was taken out on this home.
Original Mortgage
$73,500
Outstanding Balance
$18,771
Interest Rate
6.9%
Estimated Equity
$677,236
Purchase Details
Closed on
Aug 10, 1994
Sold by
Frame Curtis G
Bought by
Shansey Wayne Miller and Shansey Josephine Mary
Create a Home Valuation Report for This Property
The Home Valuation Report is an in-depth analysis detailing your home's value as well as a comparison with similar homes in the area
Home Values in the Area
Average Home Value in this Area
Purchase History
| Date | Buyer | Sale Price | Title Company |
|---|---|---|---|
| Drew Josephine M | -- | American Coast Title | |
| Shansey Wayne Miller | -- | -- |
Source: Public Records
Mortgage History
| Date | Status | Borrower | Loan Amount |
|---|---|---|---|
| Open | Drew Josephine M | $73,500 |
Source: Public Records
Tax History
| Year | Tax Paid | Tax Assessment Tax Assessment Total Assessment is a certain percentage of the fair market value that is determined by local assessors to be the total taxable value of land and additions on the property. | Land | Improvement |
|---|---|---|---|---|
| 2025 | $1,563 | $63,185 | $21,543 | $41,642 |
| 2024 | $1,563 | $61,947 | $21,121 | $40,826 |
| 2023 | $1,524 | $60,733 | $20,707 | $40,026 |
| 2022 | $1,458 | $59,543 | $20,301 | $39,242 |
| 2021 | $1,432 | $58,376 | $19,903 | $38,473 |
| 2020 | $1,401 | $57,778 | $19,699 | $38,079 |
| 2019 | $1,366 | $56,646 | $19,313 | $37,333 |
| 2018 | $1,293 | $55,536 | $18,935 | $36,601 |
| 2016 | $1,234 | $53,381 | $18,200 | $35,181 |
| 2015 | $1,197 | $52,580 | $17,927 | $34,653 |
| 2014 | $1,192 | $51,551 | $17,576 | $33,975 |
Source: Public Records
Map
Nearby Homes
- 21314 Kinard Ave
- 21602 S Figueroa St
- 518 W 213th St
- 21103 Shearer Ave
- 149 E 211th St
- 334 W 220th St
- 21328 Orrick Ave
- 21610 Orrick Ave Unit 7
- 715 W 220th St Unit 47
- 22031 Main St Unit 1
- 21836 S Vermont Ave Unit 6
- 21111 Dolores St
- 21111 Dolores St Unit 54
- 806 W 219th St
- 21403 Catskill Ave
- 21854 S Vermont Ave Unit 8
- 413 W 223rd St
- 21719 Neptune Ave
- 434 W 223rd St
- 1007 W 213th St
- 21501 Nicolle Ave
- 21511 Nicolle Ave
- 21506 Moneta Ave
- 21429 Nicolle Ave
- 21517 Nicolle Ave
- 21512 Moneta Ave
- 21502 Moneta Ave
- 21518 Moneta Ave
- 21520 Moneta Ave
- 21428 Moneta Ave
- 21423 Nicolle Ave
- 21508 Nicolle Ave
- 21523 Nicolle Ave
- 21422 Moneta Ave
- 160 W Desford St
- 21524 Moneta Ave
- 21419 Nicolle Ave
- 21528 Moneta Ave
- 207 W Ritner St
- 21416 Moneta Ave
Your Personal Tour Guide
Ask me questions while you tour the home.