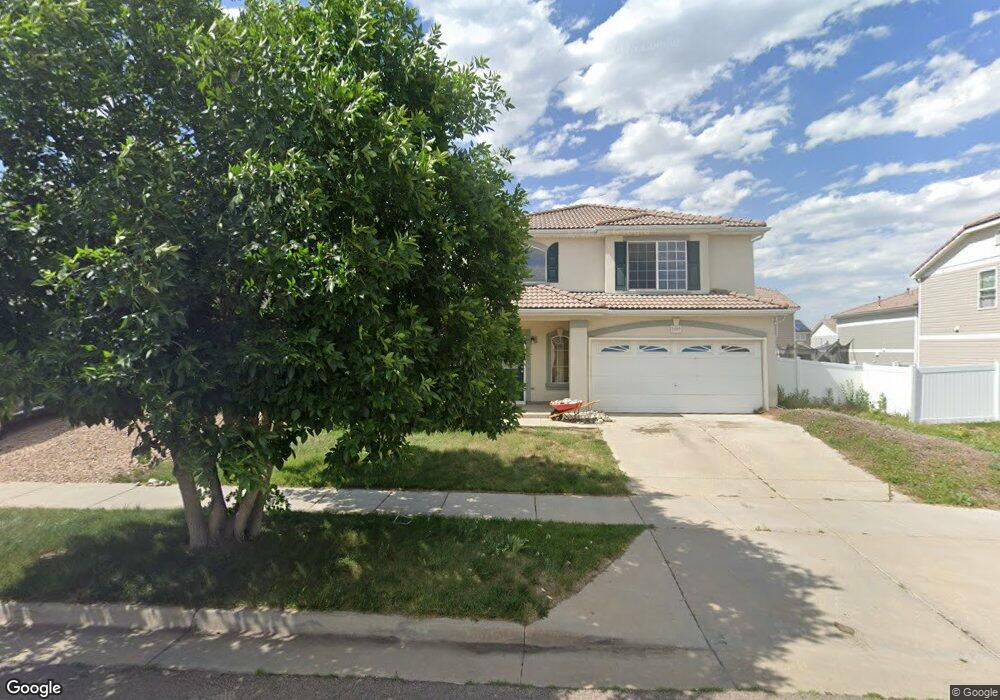
21507 E 42nd Ave Denver, CO 80249
Green Valley Ranch NeighborhoodEstimated Value: $277,000 - $402,686
About This Home
This home is located at 21507 E 42nd Ave, Denver, CO 80249 and is currently estimated at $334,922, approximately $221 per square foot. 21507 E 42nd Ave is a home located in Denver County with nearby schools including Green Valley Elementary School, Pitt-Waller K-8 School, and McGlone Academy.
Ownership History
We collect this data history from publicly available records. To have your information removed, we recommend requesting removal directly through your county’s website.
Purchase Details
Home Financials for this Owner
Home Financials are based on the most recent Mortgage that was taken out on this home.Purchase Details
Purchase Details
Purchase Details
Home Financials for this Owner
Home Financials are based on the most recent Mortgage that was taken out on this home.Home Values in the Area
Average Home Value in this Area
Purchase History
We collect this data history from publicly available records. To have your information removed, we recommend requesting removal directly through your county’s website.
| Date | Buyer | Sale Price | Title Company |
|---|---|---|---|
| $204,158 | Wfg National Title | ||
| -- | None Available | ||
| -- | None Available | ||
| $182,800 | Town & Country Title Service |
Mortgage History
We collect this data history from publicly available records. To have your information removed, we recommend requesting removal directly through your county’s website.
| Date | Status | Borrower | Loan Amount |
|---|---|---|---|
| Open | $200,459 | ||
| Previous Owner | $182,722 |
Tax History
We collect this data history from publicly available records. To have your information removed, we recommend requesting removal directly through your county’s website.
| Year | Tax Paid | Tax Assessment Tax Assessment Total Assessment is a certain percentage of the fair market value that is determined by local assessors to be the total taxable value of land and additions on the property. | Land | Improvement |
|---|---|---|---|---|
| 2025 | $1,628 | $17,840 | $4,850 | $4,850 |
| 2024 | $1,121 | $11,890 | $920 | $10,970 |
| 2023 | $1,064 | $11,890 | $920 | $10,970 |
| 2022 | $1,467 | $14,730 | $3,820 | $10,910 |
| 2021 | $1,436 | $15,160 | $3,930 | $11,230 |
| 2020 | $1,377 | $14,600 | $3,280 | $11,320 |
| 2019 | $1,993 | $21,610 | $3,280 | $18,330 |
| 2018 | $1,861 | $19,100 | $2,640 | $16,460 |
| 2017 | $1,857 | $19,100 | $2,640 | $16,460 |
| 2016 | $1,613 | $15,870 | $2,555 | $13,315 |
| 2015 | $1,559 | $15,870 | $2,555 | $13,315 |
| 2014 | $1,060 | $10,280 | $2,388 | $7,892 |
Map
- 21430 E 42nd Ave
- 4403 Picadilly Ct
- 4435 Picadilly Ct
- 4029 Orleans St
- 4022 Perth St
- 4169 N Quatar Ct
- 4074 Picadilly Ct
- 21535 E 39th Ave
- 4073 N Quatar Ct
- 4130 N Quatar Ct
- 4032 N Quatar Ct
- 21434 E 47th Ave
- 20982 E 40th Place
- 21532 E 47th Ave
- 3851 Orleans St
- 3934 N Quatar Ct
- 4448 Riviera Ct
- 21539 E 47th Ave
- 21782 E 46th Place
- 21792 E 46th Place
- 21511 E 42nd Ave
- 21501 E 42nd Ave
- 21522 E 43rd Ave
- 21512 E 43rd Ave
- 21532 E 43rd Ave
- 21502 E 43rd Ave
- 21541 E 42nd Ave
- 21542 E 43rd Ave
- 21490 E 42nd Ave
- 21506 E 42nd Ave
- 21516 E 42nd Ave
- 21470 E 42nd Ave
- 21513 E 43rd Ave
- 21481 E 42nd Ave
- 21523 E 43rd Ave
- 4235 Orleans St
- 21526 E 42nd Ave
- 21533 E 43rd Ave
- 21503 E 43rd Ave
- 4265 Orleans St
Ask me questions while you tour the home.