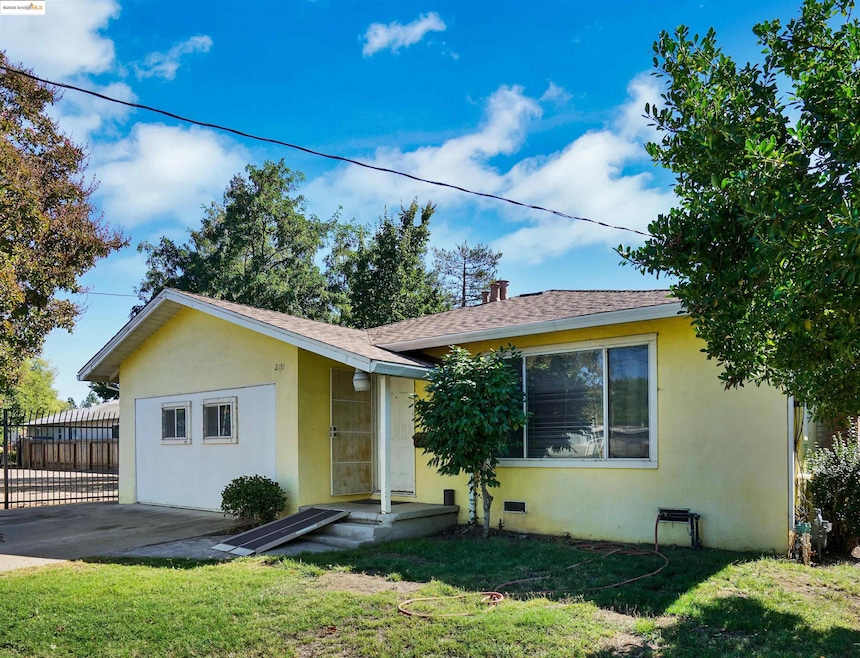
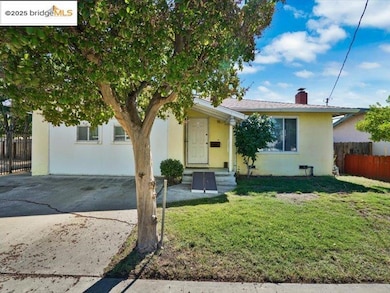
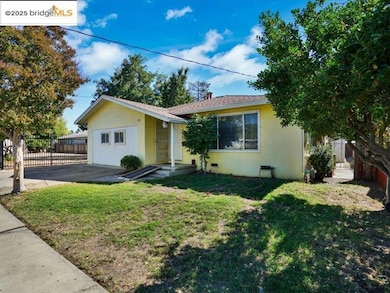
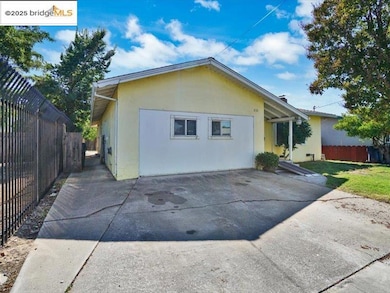
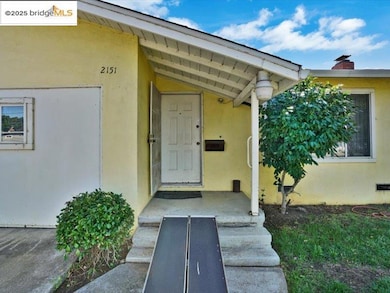
2151 Elm St Livermore, CA 94551
Downtown Livermore NeighborhoodEstimated payment $4,786/month
Highlights
- Wood Flooring
- Window or Skylight in Bathroom
- Converted Garage
- Livermore High School Rated A-
- No HOA
- Eat-In Kitchen
About This Home
A home with generous sized rooms and enormous potential awaits the sweat equity homeowner who can handle a paintbrush and hammer. Why let a flipper overcharge you and reap all the benefits? Of course you can do this! Let’s look at the upside: Original hardwood floors under carpet? Yes. New (2024) roof? Yes. Section 1 pest clearance? 99% done. Biggest kitchen, dining and living room EVER in a 1599 sq ft home? Absolutely! Close to shopping and fun? You betcha. So, what’s the catch? A well maintained, functional interior from a by-gone era. Thirsty yards and a sunburned sunroom. Your fathers paint inside and out. Priced to reflect the opportunity- Carpe Diem
Listing Agent
Colin Hill
Advantage Real Estate Group License #01361558 Listed on: 10/09/2025
Home Details
Home Type
- Single Family
Est. Annual Taxes
- $3,674
Year Built
- Built in 1957
Lot Details
- 5,000 Sq Ft Lot
- Northwest Facing Home
- Property is Fully Fenced
- Landscaped
- Rectangular Lot
- Level Lot
- Back, Front, and Side Yard
- Garden
Home Design
- Shingle Roof
- Stucco
Interior Spaces
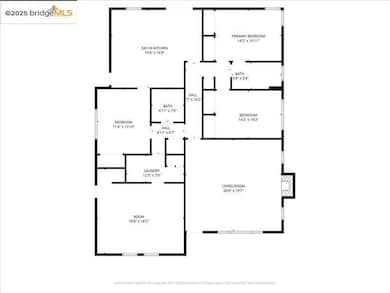
- 1,599 Sq Ft Home
- 1-Story Property
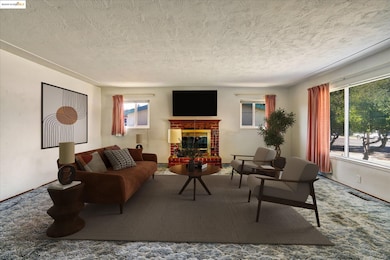
- Brick Fireplace
- Dining Area
- Crawl Space
- Fire and Smoke Detector
Kitchen
- Eat-In Kitchen
- Gas Range
- Free-Standing Range
- Dishwasher
- Laminate Countertops
- Disposal
Flooring
- Wood
- Carpet
- Vinyl
Bedrooms and Bathrooms
- 3 Bedrooms
- 2 Full Bathrooms
- Separate Shower in Primary Bathroom
- Window or Skylight in Bathroom
Laundry
- Laundry Room
- Dryer
- Washer
Parking
- 2 Parking Spaces
- Converted Garage
- Parking Available
- Side by Side Parking
- Parking Lot
- Off-Street Parking
Utilities
- Forced Air Heating and Cooling System
- Heating System Uses Natural Gas
- Gas Water Heater
Community Details
- No Home Owners Association
- Bridge Aor Association
- Northside Subdivision
Map
Home Values in the Area
Average Home Value in this Area
Tax History
| Year | Tax Paid | Tax Assessment Tax Assessment Total Assessment is a certain percentage of the fair market value that is determined by local assessors to be the total taxable value of land and additions on the property. | Land | Improvement |
|---|---|---|---|---|
| 2025 | $3,674 | $227,015 | $87,620 | $139,395 |
| 2024 | $3,674 | $222,565 | $85,902 | $136,663 |
| 2023 | $3,601 | $218,201 | $84,218 | $133,983 |
| 2022 | $3,532 | $213,922 | $82,566 | $131,356 |
| 2021 | $2,706 | $209,729 | $80,948 | $128,781 |
| 2020 | $3,333 | $207,578 | $80,118 | $127,460 |
| 2019 | $3,334 | $203,508 | $78,547 | $124,961 |
| 2018 | $3,246 | $199,518 | $77,007 | $122,511 |
| 2017 | $3,150 | $195,607 | $75,497 | $120,110 |
| 2016 | $3,014 | $191,772 | $74,017 | $117,755 |
| 2015 | $2,839 | $188,893 | $72,906 | $115,987 |
| 2014 | $2,785 | $185,193 | $71,478 | $113,715 |
Property History
| Date | Event | Price | List to Sale | Price per Sq Ft |
|---|---|---|---|---|
| 11/05/2025 11/05/25 | Price Changed | $850,000 | -2.9% | $532 / Sq Ft |
| 10/29/2025 10/29/25 | For Sale | $875,000 | 0.0% | $547 / Sq Ft |
| 10/23/2025 10/23/25 | Pending | -- | -- | -- |
| 10/09/2025 10/09/25 | For Sale | $875,000 | -- | $547 / Sq Ft |
Purchase History
| Date | Type | Sale Price | Title Company |
|---|---|---|---|
| Interfamily Deed Transfer | -- | None Available | |
| Interfamily Deed Transfer | -- | None Available | |
| Interfamily Deed Transfer | -- | -- |
Source: bridgeMLS
MLS Number: 41114329
APN: 098-0224-008-00
Disclaimer: Certain information contained herein is derived from information provided by parties other than Homes.com. All information provided is deemed reliable, but is not guaranteed to be accurate and should be independently verified.
![]() Bay East 2025. CCAR 2025. bridgeMLS 2025. Information Deemed Reliable But Not Guaranteed. This information is being provided by the Bay East MLS, or CCAR MLS, or bridgeMLS. The listings presented here may or may not be listed by the Broker/Agent operating this website. This information is intended for the personal use of consumers and may not be used for any purpose other than to identify prospective properties consumers may be interested in purchasing.
Bay East 2025. CCAR 2025. bridgeMLS 2025. Information Deemed Reliable But Not Guaranteed. This information is being provided by the Bay East MLS, or CCAR MLS, or bridgeMLS. The listings presented here may or may not be listed by the Broker/Agent operating this website. This information is intended for the personal use of consumers and may not be used for any purpose other than to identify prospective properties consumers may be interested in purchasing.
- 2056 Elm St
- 2145 Linden St
- 0 N K St
- 1935 Pine St
- 1844 Elm St
- 1815 Pine St
- 161 N L St Unit 101
- 1948 Railroad Ave Unit 104
- 1121 N P St
- 2845 Briarwood Dr
- 655 James St
- 513 Briarwood Ct
- 1949 Paseo Laguna Seco
- 2908 Worthing Common
- 1821 Paseo Laguna Seco
- 1785 Paseo Laguna Seco
- 1320 Ventura Ave
- 2542 Fourth St
- 1727 2nd St
- Plan 1 at Parkview
- 595 N L St Unit Apartment
- 434 Junction Ave
- 2255 Chestnut St Unit 12
- 1160 Portola Meadows Rd
- 170 N N St Unit 116
- 1536 Corte Reina Common
- 1809 Railroad Ave
- 1900-1996 1st St
- 1374 Olivina Ave Unit Front unit A
- 2904 Worthing Common
- 2397 Third St
- 981 Marylin Ave Unit ADU
- 1700 Paseo Laguna Seco Dr
- 893 Olivina Ave Unit ID1305125P
- 3909 Portola Common
- 1167 Holmes Ct
- 800 E Stanley Blvd
- 1009 Murrieta Blvd Unit 45
- 3819 East Ave
- 3550 Pacific Ave