
Seller's Agent in 2019
Scott Niles
eHomes
(714) 244-2744
19 Total Sales
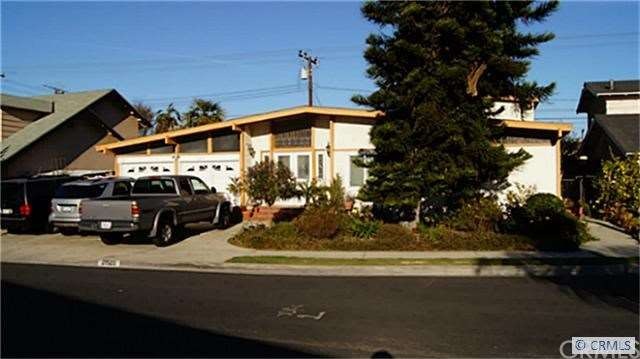
Very nice house.
Last Buyer's Agent
DANIEL CARLESS
DANIEL G CARLESS, BROKER License #01124613
| Date | Type | Sale Price | Title Company |
|---|---|---|---|
| Interfamily Deed Transfer | -- | Wfg National Title Company | |
| Interfamily Deed Transfer | -- | Wfg National Title Company | |
| Interfamily Deed Transfer | -- | None Available | |
| Interfamily Deed Transfer | -- | Amrock Inc | |
| Interfamily Deed Transfer | -- | Amrock | |
| Warranty Deed | -- | None Available | |
| Warranty Deed | -- | None Available | |
| Grant Deed | $740,000 | Stewart Title | |
| Grant Deed | $328,000 | Stewart Title | |
| Interfamily Deed Transfer | -- | Old Republic Title | |
| Grant Deed | $198,000 | Investors Title Company | |
| Trustee Deed | $155,008 | First American Title Ins Co | |
| Grant Deed | $185,000 | Continental Lawyers Title Co | |
| Trustee Deed | $146,667 | Chicago Title Company |
| Date | Status | Loan Amount | Loan Type |
|---|---|---|---|
| Open | $559,000 | New Conventional | |
| Closed | $568,000 | New Conventional | |
| Previous Owner | $580,000 | New Conventional | |
| Previous Owner | $451,600 | Stand Alone Refi Refinance Of Original Loan | |
| Previous Owner | $451,600 | Purchase Money Mortgage | |
| Previous Owner | $568,000 | New Conventional | |
| Previous Owner | $560,000 | Unknown | |
| Previous Owner | $70,000 | Stand Alone Second | |
| Previous Owner | $571,500 | Fannie Mae Freddie Mac | |
| Previous Owner | $75,000 | Credit Line Revolving | |
| Previous Owner | $450,400 | Stand Alone First | |
| Previous Owner | $436,000 | New Conventional | |
| Previous Owner | $373,500 | Unknown | |
| Previous Owner | $324,000 | Unknown | |
| Previous Owner | $292,500 | Unknown | |
| Previous Owner | $255,000 | Unknown | |
| Previous Owner | $213,750 | Unknown | |
| Previous Owner | $177,550 | No Value Available | |
| Previous Owner | $148,000 | No Value Available |
| Date | Event | Price | Change | Sq Ft Price |
|---|---|---|---|---|
| 02/15/2019 02/15/19 | Sold | $740,000 | 0.0% | $306 / Sq Ft |
| 01/24/2019 01/24/19 | Price Changed | $740,000 | +7.4% | $306 / Sq Ft |
| 01/22/2019 01/22/19 | Pending | -- | -- | -- |
| 11/09/2018 11/09/18 | For Sale | $689,000 | +110.1% | $285 / Sq Ft |
| 10/23/2017 10/23/17 | Sold | $328,000 | +13.1% | $168 / Sq Ft |
| 06/08/2017 06/08/17 | Price Changed | $290,000 | -3.3% | $149 / Sq Ft |
| 04/24/2017 04/24/17 | Pending | -- | -- | -- |
| 04/01/2017 04/01/17 | For Sale | $300,000 | +22.4% | $154 / Sq Ft |
| 01/09/2013 01/09/13 | Sold | $245,000 | +6.5% | $126 / Sq Ft |
| 10/12/2012 10/12/12 | Price Changed | $230,000 | -14.8% | $118 / Sq Ft |
| 06/29/2012 06/29/12 | Pending | -- | -- | -- |
| 06/29/2012 06/29/12 | For Sale | $270,000 | +10.2% | $139 / Sq Ft |
| 06/15/2012 06/15/12 | Off Market | $245,000 | -- | -- |
| 06/14/2012 06/14/12 | Price Changed | $270,000 | -1.8% | $139 / Sq Ft |
| 06/13/2012 06/13/12 | For Sale | $275,000 | 0.0% | $141 / Sq Ft |
| 06/13/2012 06/13/12 | Price Changed | $275,000 | +38.2% | $141 / Sq Ft |
| 05/17/2012 05/17/12 | Pending | -- | -- | -- |
| 05/17/2012 05/17/12 | Price Changed | $199,000 | -18.8% | $102 / Sq Ft |
| 05/16/2012 05/16/12 | Off Market | $245,000 | -- | -- |
| 05/16/2012 05/16/12 | For Sale | $215,000 | -12.2% | $110 / Sq Ft |
| 05/02/2012 05/02/12 | Off Market | $245,000 | -- | -- |
| 04/30/2012 04/30/12 | Price Changed | $215,000 | -20.3% | $110 / Sq Ft |
| 04/27/2012 04/27/12 | Price Changed | $269,900 | +8.0% | $138 / Sq Ft |
| 04/27/2012 04/27/12 | Price Changed | $249,900 | -7.4% | $128 / Sq Ft |
| 04/25/2012 04/25/12 | Price Changed | $269,900 | -3.6% | $138 / Sq Ft |
| 04/20/2012 04/20/12 | Price Changed | $279,900 | -1.3% | $144 / Sq Ft |
| 04/19/2012 04/19/12 | Price Changed | $283,500 | -7.0% | $145 / Sq Ft |
| 04/12/2012 04/12/12 | For Sale | $305,000 | +24.5% | $156 / Sq Ft |
| 03/27/2012 03/27/12 | Off Market | $245,000 | -- | -- |
| 03/26/2012 03/26/12 | Price Changed | $305,000 | -3.2% | $156 / Sq Ft |
| 03/22/2012 03/22/12 | For Sale | $315,000 | -- | $162 / Sq Ft |
| Year | Tax Paid | Tax Assessment Tax Assessment Total Assessment is a certain percentage of the fair market value that is determined by local assessors to be the total taxable value of land and additions on the property. | Land | Improvement |
|---|---|---|---|---|
| 2025 | $3,643 | $236,130 | $49,168 | $186,962 |
| 2024 | $3,643 | $231,501 | $48,204 | $183,297 |
| 2023 | $3,567 | $226,962 | $47,259 | $179,703 |
| 2022 | $3,398 | $222,513 | $46,333 | $176,180 |
| 2021 | $3,425 | $218,151 | $45,425 | $172,726 |
| 2020 | $9,790 | $754,800 | $510,000 | $244,800 |
| 2019 | $4,709 | $334,560 | $270,300 | $64,260 |
| 2018 | $4,597 | $328,000 | $265,000 | $63,000 |
| 2016 | $3,750 | $261,537 | $136,530 | $125,007 |
| 2015 | $3,672 | $257,610 | $134,480 | $123,130 |
| 2014 | $3,665 | $252,565 | $131,846 | $120,719 |
Seller's Agent in 2019
Scott Niles
eHomes
(714) 244-2744
19 Total Sales
Seller Co-Listing Agent in 2019
Sean Haghi
Elements Real Estate
(310) 577-8777
13 Total Sales
A
Buyer's Agent in 2019
Adam Rosal
eXp Realty of California Inc
(310) 880-4523
K
Seller's Agent in 2017
Kim Gueche
F.A.I.R. Plan Inc
D
Buyer's Agent in 2017
David Berenato
Redfin Corporation
Seller's Agent in 2013
Ernie Lim
Ernie Lim, Broker
(714) 224-8321
23 Total Sales
Source: California Regional Multiple Listing Service (CRMLS)
MLS Number: P816302
APN: 7334-020-061
Disclaimer: Certain information contained herein is derived from information provided by parties other than Homes.com. All information provided is deemed reliable, but is not guaranteed to be accurate and should be independently verified.
![]() The multiple listing data appearing on this website, or contained in reports produced therefrom, is owned and copyrighted by California Regional Multiple Listing Service, Inc. ("CRMLS") and is protected by all applicable copyright laws. Information provided is for viewer's personal, non-commercial use and may not be used for any purpose other than to identify prospective properties the viewer may be interested in purchasing. All listing data, including but not limited to square footage and lot size is believed to be accurate, but the listing Agent, listing Broker and CRMLS and its affiliates do not warrant or guarantee such accuracy. The viewer should independently verify the listed data prior to making any decisions based on such information by personal inspection and/or contacting a real estate professional.
The multiple listing data appearing on this website, or contained in reports produced therefrom, is owned and copyrighted by California Regional Multiple Listing Service, Inc. ("CRMLS") and is protected by all applicable copyright laws. Information provided is for viewer's personal, non-commercial use and may not be used for any purpose other than to identify prospective properties the viewer may be interested in purchasing. All listing data, including but not limited to square footage and lot size is believed to be accurate, but the listing Agent, listing Broker and CRMLS and its affiliates do not warrant or guarantee such accuracy. The viewer should independently verify the listed data prior to making any decisions based on such information by personal inspection and/or contacting a real estate professional.
Based on information from California Regional Multiple Listing Service, Inc. and /or other sources. All data, including all measurements and calculations of area, is obtained from various sources and has not been, and will not be, verified by broker or MLS. All information should be independently reviewed and verified for accuracy. Properties may or may not be listed by the office/agent presenting the information