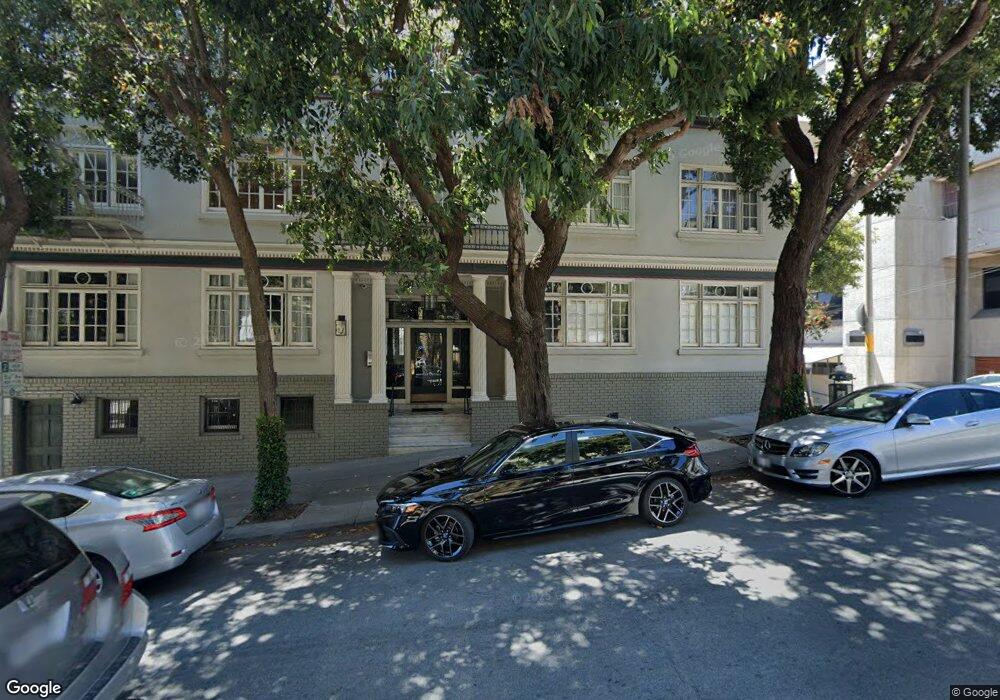
2155 Buchanan St Unit 9 San Francisco, CA 94115
Pacific Heights NeighborhoodEstimated Value: $1,381,000 - $1,520,000
2
Beds
1
Bath
1,120
Sq Ft
$1,280/Sq Ft
Est. Value
About This Home
This home is located at 2155 Buchanan St Unit 9, San Francisco, CA 94115 and is currently estimated at $1,433,604, approximately $1,280 per square foot. 2155 Buchanan St Unit 9 is a home located in San Francisco County with nearby schools including Sherman Elementary, Marina Middle School, and Mary L. Booker Leadership Academy.
Ownership History
Date
Name
Owned For
Owner Type
Purchase Details
Closed on
Mar 21, 2019
Sold by
Carr Marie T and Hadley David R
Bought by
Carr Marie T and Hadley David R
Current Estimated Value
Purchase Details
Closed on
Oct 23, 2018
Sold by
Magee Catherine A
Bought by
Carr Marie T and Carr David R
Home Financials for this Owner
Home Financials are based on the most recent Mortgage that was taken out on this home.
Original Mortgage
$679,650
Outstanding Balance
$595,205
Interest Rate
4.7%
Mortgage Type
New Conventional
Estimated Equity
$838,399
Purchase Details
Closed on
Sep 11, 2016
Sold by
Carr Marie T and Magee Catherine A
Bought by
Carr Marie T and Magee Catherine A
Purchase Details
Closed on
Dec 1, 2014
Sold by
Carr Marie T and Carr Carolyn M
Bought by
Carr Marie T
Purchase Details
Closed on
Feb 17, 2009
Sold by
Kennison Brian
Bought by
Carr Marie T and Carr Carolyn
Home Financials for this Owner
Home Financials are based on the most recent Mortgage that was taken out on this home.
Original Mortgage
$262,850
Interest Rate
4.91%
Mortgage Type
Purchase Money Mortgage
Purchase Details
Closed on
Jun 6, 2006
Sold by
Kim Alan D and Kim Susan C
Bought by
Kennison Brian
Home Financials for this Owner
Home Financials are based on the most recent Mortgage that was taken out on this home.
Original Mortgage
$760,000
Interest Rate
6.4%
Mortgage Type
Purchase Money Mortgage
Purchase Details
Closed on
Nov 13, 2003
Sold by
Wilcox Lynn P
Bought by
Kim Alan D and Kim Susan C
Home Financials for this Owner
Home Financials are based on the most recent Mortgage that was taken out on this home.
Original Mortgage
$640,000
Interest Rate
5.37%
Mortgage Type
Purchase Money Mortgage
Purchase Details
Closed on
Feb 24, 2003
Sold by
Wilcox Donald F and Wilcox Sharon K
Bought by
Wilcox Lynn P
Home Financials for this Owner
Home Financials are based on the most recent Mortgage that was taken out on this home.
Original Mortgage
$267,000
Interest Rate
5.85%
Purchase Details
Closed on
Apr 27, 1994
Sold by
Wilcox Lynn P and Wilcox Donald F
Bought by
Wilcox Donald F and Wilcox Sharon K
Purchase Details
Closed on
Feb 3, 1994
Sold by
Wilcox Donald F and Wilcox Sharon K
Bought by
Wilcox Lynn P and Wilcox Donald F
Home Financials for this Owner
Home Financials are based on the most recent Mortgage that was taken out on this home.
Original Mortgage
$292,000
Interest Rate
7.1%
Create a Home Valuation Report for This Property
The Home Valuation Report is an in-depth analysis detailing your home's value as well as a comparison with similar homes in the area
Home Values in the Area
Average Home Value in this Area
Purchase History
| Date | Buyer | Sale Price | Title Company |
|---|---|---|---|
| Carr Marie T | -- | None Available | |
| Carr Marie T | -- | None Available | |
| Carr Marie T | $340,000 | Fidelity Title Co Concord | |
| Carr Marie T | -- | None Available | |
| Magee Catherine A | -- | None Available | |
| Carr Marie T | -- | None Available | |
| Carr Marie T | $900,000 | Chicago Title Company | |
| Kennison Brian | $1,000,000 | Chicago Title Co | |
| Kim Alan D | $800,000 | First American Title Company | |
| Wilcox Lynn P | -- | First American Title Company | |
| Wilcox Donald F | -- | -- | |
| Wilcox Lynn P | -- | Chicago Title Company |
Source: Public Records
Mortgage History
| Date | Status | Borrower | Loan Amount |
|---|---|---|---|
| Open | Carr Marie T | $679,650 | |
| Previous Owner | Carr Marie T | $262,850 | |
| Previous Owner | Kennison Brian | $760,000 | |
| Previous Owner | Kim Alan D | $640,000 | |
| Previous Owner | Wilcox Lynn P | $267,000 | |
| Previous Owner | Wilcox Lynn P | $292,000 |
Source: Public Records
Tax History Compared to Growth
Tax History
| Year | Tax Paid | Tax Assessment Tax Assessment Total Assessment is a certain percentage of the fair market value that is determined by local assessors to be the total taxable value of land and additions on the property. | Land | Improvement |
|---|---|---|---|---|
| 2025 | $19,301 | $1,607,404 | $964,443 | $642,961 |
| 2024 | $19,301 | $1,575,888 | $945,533 | $630,355 |
| 2023 | $18,999 | $1,544,992 | $926,995 | $617,997 |
| 2022 | $18,635 | $1,514,700 | $908,820 | $605,880 |
| 2021 | $16,095 | $1,297,970 | $648,985 | $648,985 |
| 2020 | $16,169 | $1,284,664 | $642,332 | $642,332 |
| 2019 | $15,666 | $1,259,476 | $629,738 | $629,738 |
| 2018 | $12,496 | $1,018,584 | $509,292 | $509,292 |
| 2017 | $12,049 | $998,612 | $499,306 | $499,306 |
| 2016 | $11,847 | $979,032 | $489,516 | $489,516 |
| 2015 | $11,699 | $964,328 | $482,164 | $482,164 |
| 2014 | $11,391 | $945,440 | $472,720 | $472,720 |
Source: Public Records
Map
Nearby Homes
- 2205 Sacramento St Unit 302
- 2200 Sacramento St Unit 1005
- 2215 California St
- 2218 Clay St
- 2020 Webster St
- 2275 California St
- 2112 Pine St Unit B
- 1914 Pine St Unit 8
- 1914 Pine St Unit 5
- 1942 Bush St
- 2198 Jackson St
- 2109 Bush St
- 1865 Pine St
- 1925 Gough St Unit 51
- 1925 Gough St Unit 22
- 1715 Webster St
- 2200 Pacific Ave Unit 8E
- 2200 Pacific Ave Unit 9E
- 1705 Gough St
- 2185 Bush St Unit 206
- 2155 Buchanan St Unit 10
- 2155 Buchanan St Unit 8
- 2155 Buchanan St Unit 7
- 2155 Buchanan St Unit 5
- 2155 Buchanan St Unit 4
- 2155 Buchanan St Unit 3
- 2155 Buchanan St Unit 2
- 2155 Buchanan St Unit 1
- 2309 Sacramento St
- 2307 Sacramento St
- 2305 Sacramento St
- 2303 Sacramento St Unit 2303
- 2315 Sacramento St
- 2299 Sacramento St Unit 20
- 2299 Sacramento St Unit 19
- 2299 Sacramento St Unit 17
- 2299 Sacramento St Unit 16
- 2299 Sacramento St Unit 14
- 2299 Sacramento St Unit 12
- 2299 Sacramento St Unit 11