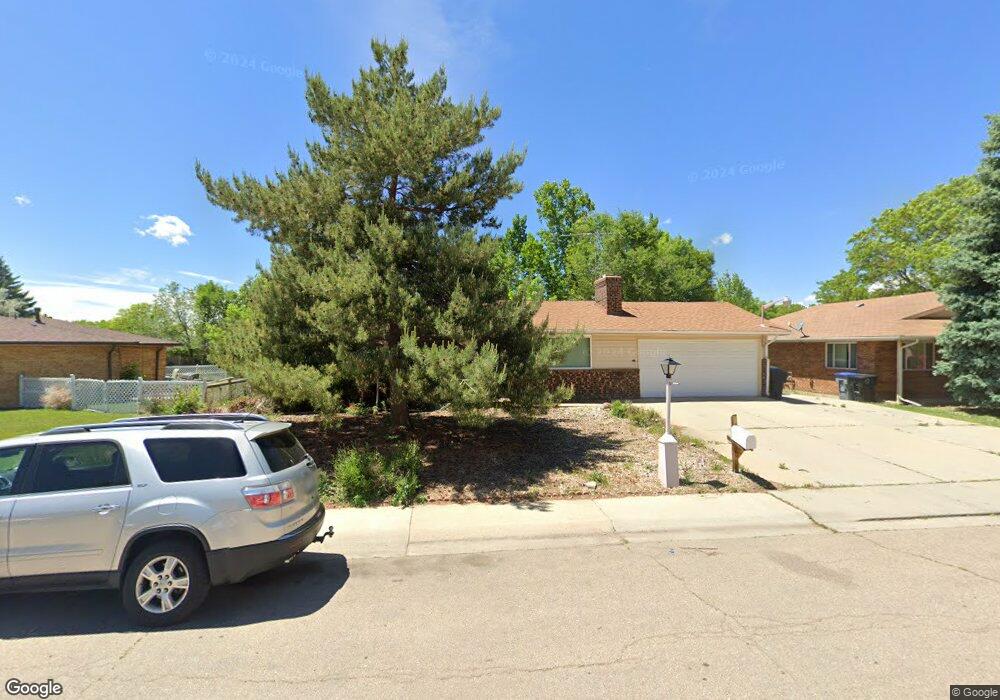
2155 Dexter Dr Longmont, CO 80501
Lanyon NeighborhoodEstimated Value: $435,186 - $560,000
5
Beds
2
Baths
1,975
Sq Ft
$241/Sq Ft
Est. Value
About This Home
This home is located at 2155 Dexter Dr, Longmont, CO 80501 and is currently estimated at $475,047, approximately $240 per square foot. 2155 Dexter Dr is a home located in Boulder County with nearby schools including Timberline Pk-8, Skyline High School, and The Cottage School - Terry.
Ownership History
Date
Name
Owned For
Owner Type
Purchase Details
Closed on
Feb 25, 2008
Sold by
Deutsche Bank National Trust Co
Bought by
Higby April S
Current Estimated Value
Home Financials for this Owner
Home Financials are based on the most recent Mortgage that was taken out on this home.
Original Mortgage
$137,837
Outstanding Balance
$85,547
Interest Rate
5.67%
Mortgage Type
FHA
Estimated Equity
$389,500
Purchase Details
Closed on
Dec 7, 2007
Sold by
Nunez Ausencio N and Nunez Luz
Bought by
Deutsche Bank National Trust Co
Purchase Details
Closed on
Mar 21, 1994
Sold by
Hubble Wayne C
Bought by
Nunez Ausencio N
Home Financials for this Owner
Home Financials are based on the most recent Mortgage that was taken out on this home.
Original Mortgage
$100,322
Interest Rate
7.21%
Mortgage Type
FHA
Purchase Details
Closed on
Aug 5, 1993
Bought by
Higby April S
Purchase Details
Closed on
Aug 24, 1992
Bought by
Higby April S
Purchase Details
Closed on
Oct 24, 1978
Bought by
Higby April S
Create a Home Valuation Report for This Property
The Home Valuation Report is an in-depth analysis detailing your home's value as well as a comparison with similar homes in the area
Home Values in the Area
Average Home Value in this Area
Purchase History
| Date | Buyer | Sale Price | Title Company |
|---|---|---|---|
| Higby April S | $140,000 | None Available | |
| Deutsche Bank National Trust Co | -- | None Available | |
| Nunez Ausencio N | $111,500 | -- | |
| Higby April S | $104,000 | -- | |
| Higby April S | -- | -- | |
| Higby April S | $53,000 | -- |
Source: Public Records
Mortgage History
| Date | Status | Borrower | Loan Amount |
|---|---|---|---|
| Open | Higby April S | $137,837 | |
| Previous Owner | Nunez Ausencio N | $100,322 |
Source: Public Records
Tax History Compared to Growth
Tax History
| Year | Tax Paid | Tax Assessment Tax Assessment Total Assessment is a certain percentage of the fair market value that is determined by local assessors to be the total taxable value of land and additions on the property. | Land | Improvement |
|---|---|---|---|---|
| 2025 | $2,118 | $27,157 | $8,794 | $18,363 |
| 2024 | $2,118 | $27,157 | $8,794 | $18,363 |
| 2023 | $2,089 | $22,144 | $9,728 | $16,100 |
| 2022 | $1,933 | $19,537 | $7,388 | $12,149 |
| 2021 | $1,958 | $20,098 | $7,600 | $12,498 |
| 2020 | $2,050 | $21,107 | $6,936 | $14,171 |
| 2019 | $2,018 | $21,107 | $6,936 | $14,171 |
| 2018 | $1,680 | $17,690 | $6,984 | $10,706 |
| 2017 | $1,657 | $19,558 | $7,721 | $11,837 |
| 2016 | $1,531 | $16,015 | $6,129 | $9,886 |
| 2015 | $1,459 | $13,102 | $4,139 | $8,963 |
| 2014 | $1,224 | $13,102 | $4,139 | $8,963 |
Source: Public Records
Map
Nearby Homes
- 2213 Emery St Unit C
- 2144 Collyer St
- 2143 Meadow Ct
- 22 Emery Way
- 2148 Meadow Ct
- 207 23rd Ave
- 1933 Emery St
- 1943 Meadow Dr Unit B2
- 50 19th Ave
- 1818 Atwood St
- 1005 Harmon Place
- 2258 Whistler Dr
- 2014 Red Cloud Rd
- 1771 Centennial Dr
- 2190 Winding Dr
- 2217 Steppe Dr
- 221 Homestead Pkwy
- 1700 Jewel Dr
- 1877 Queens Dr
- 1140 Parker Dr
- 2163 Dexter Dr
- 2139 Dexter Dr
- 2140 Emery St
- 2114 Dexter Dr
- 2154 Dexter Dr Unit 2158
- 2154 Dexter Dr
- 2144 Dexter Dr
- 2150 Dexter Dr
- 2207 Dexter Dr
- 2202 Dexter Dr
- 2129 Dexter Dr
- 2121 Dexter Dr
- 2140 Dexter Dr
- 2141 Collyer St
- 2108 Emery St
- 2149 Collyer St
- 2133 Collyer St
- 2137 Dexter Dr
- 2137 Dexter Dr Unit D
- 2215 Dexter Dr