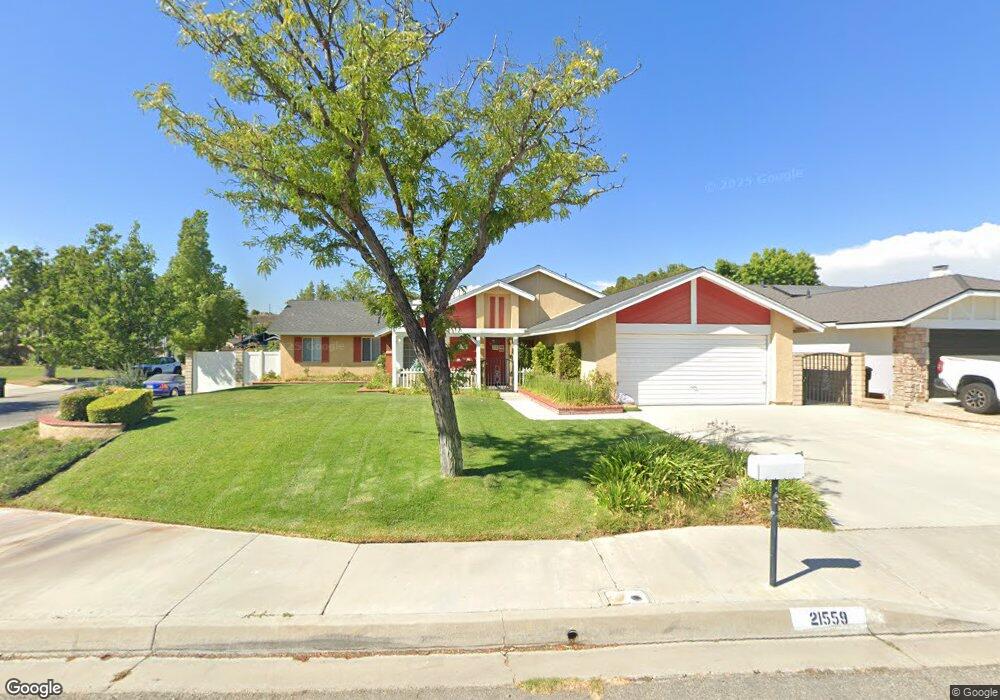
21559 Quinn Place Santa Clarita, CA 91350
Saugus NeighborhoodEstimated Value: $806,613 - $853,000
5
Beds
3
Baths
1,832
Sq Ft
$453/Sq Ft
Est. Value
About This Home
This home is located at 21559 Quinn Place, Santa Clarita, CA 91350 and is currently estimated at $829,153, approximately $452 per square foot. 21559 Quinn Place is a home located in Los Angeles County with nearby schools including Rosedell Elementary School, Arroyo Seco Junior High School, and Saugus High School.
Ownership History
Date
Name
Owned For
Owner Type
Purchase Details
Closed on
Apr 25, 2007
Sold by
Fraser Dennis M and Fraser Nenita
Bought by
Fraser Dennis M and Fraser Nenita P
Current Estimated Value
Purchase Details
Closed on
May 9, 2000
Sold by
Derosa Louis C and Derosa Kathryn A
Bought by
Fraser Dennis M and Fraser Nenita
Home Financials for this Owner
Home Financials are based on the most recent Mortgage that was taken out on this home.
Original Mortgage
$225,150
Outstanding Balance
$77,670
Interest Rate
8.12%
Estimated Equity
$751,483
Purchase Details
Closed on
Nov 10, 1995
Sold by
Lenenberg Steven R and Lenenberg Sandra J
Bought by
Derosa Louis C and Derosa Kathryn Ann
Home Financials for this Owner
Home Financials are based on the most recent Mortgage that was taken out on this home.
Original Mortgage
$162,450
Interest Rate
7.38%
Create a Home Valuation Report for This Property
The Home Valuation Report is an in-depth analysis detailing your home's value as well as a comparison with similar homes in the area
Home Values in the Area
Average Home Value in this Area
Purchase History
| Date | Buyer | Sale Price | Title Company |
|---|---|---|---|
| Fraser Dennis M | -- | None Available | |
| Fraser Dennis M | $237,000 | Investors Title Company | |
| Derosa Louis C | $171,000 | -- |
Source: Public Records
Mortgage History
| Date | Status | Borrower | Loan Amount |
|---|---|---|---|
| Open | Fraser Dennis M | $225,150 | |
| Previous Owner | Derosa Louis C | $162,450 |
Source: Public Records
Tax History Compared to Growth
Tax History
| Year | Tax Paid | Tax Assessment Tax Assessment Total Assessment is a certain percentage of the fair market value that is determined by local assessors to be the total taxable value of land and additions on the property. | Land | Improvement |
|---|---|---|---|---|
| 2025 | $5,244 | $364,242 | $179,048 | $185,194 |
| 2024 | $5,244 | $357,101 | $175,538 | $181,563 |
| 2023 | $5,091 | $350,100 | $172,097 | $178,003 |
| 2022 | $5,110 | $343,236 | $168,723 | $174,513 |
| 2021 | $5,022 | $336,507 | $165,415 | $171,092 |
| 2020 | $4,973 | $333,057 | $163,719 | $169,338 |
| 2019 | $4,846 | $326,527 | $160,509 | $166,018 |
| 2018 | $4,686 | $320,125 | $157,362 | $162,763 |
| 2016 | $4,416 | $307,696 | $151,252 | $156,444 |
| 2015 | $4,252 | $303,076 | $148,981 | $154,095 |
| 2014 | $4,186 | $297,140 | $146,063 | $151,077 |
Source: Public Records
Map
Nearby Homes
- 21560 Quinn Place
- 21643 Masterson Ct
- 27620 Susan Beth Way Unit A
- 27571 Caraway Ln
- 21929 Peppercorn Dr
- 27547 Saffron Ln
- 21123 Avenida de Sonrisa
- 21827 Centurion Way
- 28123 Bobwhite Cir Unit 104
- 28050 Devon Ln
- 21983 Centurion Way
- 27502 Caraway Ln
- 27610 Kevin Place
- 27632 Kevin Place
- 21741 Jeffers Ln
- 27641 Sutters Pointe Dr
- 27828 Parkvale Dr
- 20906 Susan Carole Dr
- 22003 Caceras St
- 27619 Ron Ridge Dr
- 21551 Quinn Place
- 27869 Ridgegrove Dr
- 27863 Ridgegrove Dr
- 21545 Quinn Place
- 27761 Barrett Dr
- 27767 Barrett Dr
- 27859 Ridgegrove Dr
- 21554 Quinn Place
- 27755 Barrett Dr
- 27773 Barrett Dr
- 21548 Quinn Place
- 27749 Barrett Dr
- 21544 Quinn Place
- 27745 Barrett Dr
- 21551 Gaff Ct
- 21555 Gaff Ct
- 27600 Solana Ln
- 27868 Ridgegrove Dr
- 21547 Gaff Ct
- 27739 Barrett Dr