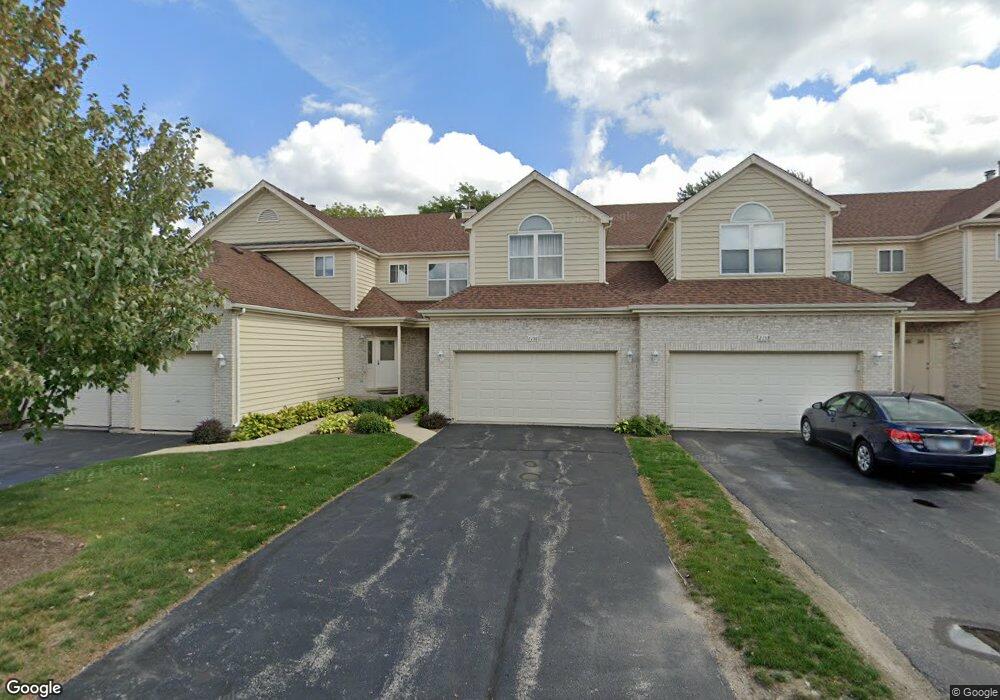
2156 Glacier Ct Unit 4 Algonquin, IL 60102
Estimated Value: $298,000 - $312,466
3
Beds
3
Baths
1,300
Sq Ft
$237/Sq Ft
Est. Value
About This Home
This home is located at 2156 Glacier Ct Unit 4, Algonquin, IL 60102 and is currently estimated at $308,117, approximately $237 per square foot. 2156 Glacier Ct Unit 4 is a home located in McHenry County with nearby schools including Algonquin Lakes Elementary School, Algonquin Middle School, and Dundee-Crown High School.
Ownership History
Date
Name
Owned For
Owner Type
Purchase Details
Closed on
Mar 15, 2004
Sold by
Pochron Linda
Bought by
Sehgal Rajneesh F and Jagtiani Archna K
Current Estimated Value
Home Financials for this Owner
Home Financials are based on the most recent Mortgage that was taken out on this home.
Original Mortgage
$172,500
Interest Rate
5.78%
Mortgage Type
Balloon
Purchase Details
Closed on
Jul 5, 2000
Sold by
Payne Sharon M and Brooks Scott T
Bought by
Pochron Stanley E
Home Financials for this Owner
Home Financials are based on the most recent Mortgage that was taken out on this home.
Original Mortgage
$133,600
Interest Rate
8.55%
Purchase Details
Closed on
May 8, 1997
Sold by
Harris Bank Barrington
Bought by
Payne Sharon M
Home Financials for this Owner
Home Financials are based on the most recent Mortgage that was taken out on this home.
Original Mortgage
$120,000
Interest Rate
8.27%
Create a Home Valuation Report for This Property
The Home Valuation Report is an in-depth analysis detailing your home's value as well as a comparison with similar homes in the area
Home Values in the Area
Average Home Value in this Area
Purchase History
| Date | Buyer | Sale Price | Title Company |
|---|---|---|---|
| Sehgal Rajneesh F | $203,000 | Ticor Title Insurance Compan | |
| Pochron Stanley E | $167,000 | -- | |
| Payne Sharon M | $152,000 | -- |
Source: Public Records
Mortgage History
| Date | Status | Borrower | Loan Amount |
|---|---|---|---|
| Closed | Sehgal Rajneesh F | $172,500 | |
| Previous Owner | Pochron Stanley E | $133,600 | |
| Previous Owner | Payne Sharon M | $120,000 |
Source: Public Records
Tax History Compared to Growth
Tax History
| Year | Tax Paid | Tax Assessment Tax Assessment Total Assessment is a certain percentage of the fair market value that is determined by local assessors to be the total taxable value of land and additions on the property. | Land | Improvement |
|---|---|---|---|---|
| 2024 | $6,977 | $90,764 | $16,269 | $74,495 |
| 2023 | $6,686 | $81,177 | $14,551 | $66,626 |
| 2022 | $6,349 | $75,335 | $13,489 | $61,846 |
| 2021 | $5,594 | $70,184 | $12,567 | $57,617 |
| 2020 | $5,448 | $67,699 | $12,122 | $55,577 |
| 2019 | $5,288 | $64,796 | $11,602 | $53,194 |
| 2018 | $5,836 | $68,593 | $10,718 | $57,875 |
| 2017 | $5,658 | $64,619 | $10,097 | $54,522 |
| 2016 | $5,562 | $60,607 | $9,470 | $51,137 |
| 2013 | -- | $46,905 | $8,834 | $38,071 |
Source: Public Records
Map
Nearby Homes
- 1670 Yosemite Pkwy
- 2150 E Algonquin Rd
- 1943 Ozark Pkwy
- 2003 Magenta Ln
- 2 Cumberland Pkwy
- 1782 Cumberland Pkwy
- 2260 Indigo Dr
- 460 Mahogany Dr
- 1770 E Algonquin Rd
- Lot 4 b Ryan Pkwy
- 400 Diamond Back Way
- 1551 Glacier Trail Unit 644
- 1659 E Algonquin Rd
- 2008 Clematis Dr
- 1730 Tanglewood Dr
- 2245 Flagstone Ln Unit 155
- 9999 Sandbloom Rd
- 1011 Wesley Ln
- 601 Lake Cornish Way
- 713 Silverstone Dr Unit 77
- 2154 Glacier Ct Unit 6
- 2152 Glacier Ct Unit 5
- 2158 Glacier Ct Unit 3
- 2162 Glacier Ct
- 2160 Glacier Ct Unit 1
- 2150 Glacier Ct Unit 8
- 2148 Glacier Ct Unit 7
- 2148 Glacier Ct Unit 1
- 2148 Glacier Ct Unit 2148
- 2146 Glacier Ct Unit 9
- 1600 Glacier Pkwy
- 2123 Glacier Ct Unit 41
- 2144 Glacier Ct Unit 10
- 2125 Glacier Ct Unit 42
- 1560 Glacier Pkwy
- 2142 Glacier Ct Unit 12
- 2202 Lake Cook Rd
- 2140 Glacier Ct Unit 11
- 2121 Glacier Ct Unit 40
- 2119 Glacier Ct Unit 39