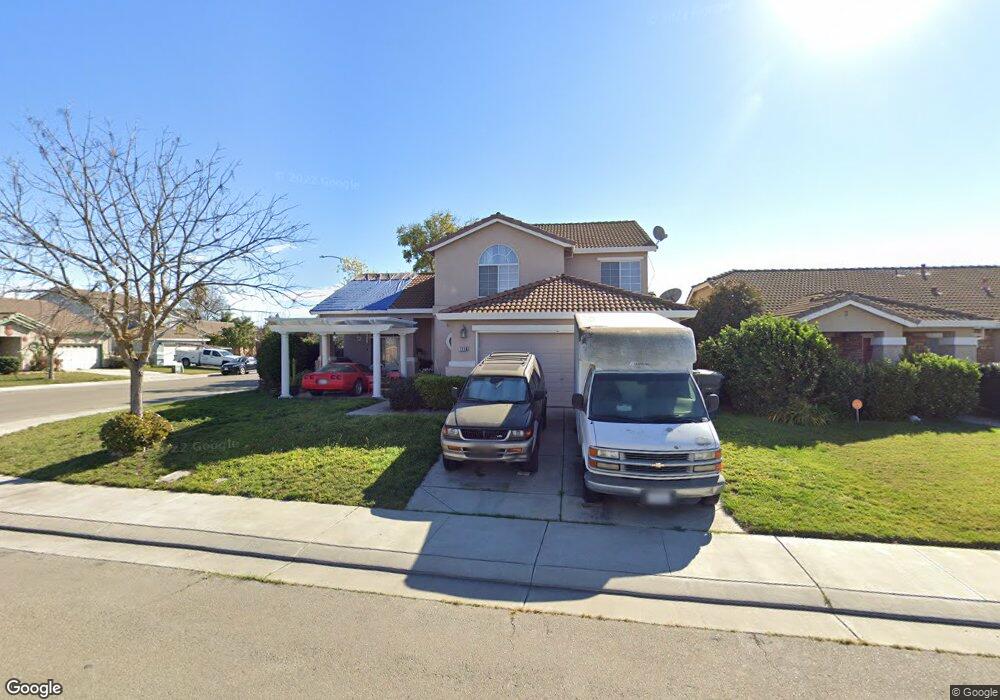
2156 Pisa Cir Stockton, CA 95206
Weston Ranch NeighborhoodEstimated Value: $394,000 - $530,000
4
Beds
3
Baths
2,231
Sq Ft
$218/Sq Ft
Est. Value
About This Home
This home is located at 2156 Pisa Cir, Stockton, CA 95206 and is currently estimated at $485,518, approximately $217 per square foot. 2156 Pisa Cir is a home located in San Joaquin County with nearby schools including August Knodt Elementary School and Weston Ranch High School.
Ownership History
Date
Name
Owned For
Owner Type
Purchase Details
Closed on
May 24, 2010
Sold by
Lenders Financial Group Llc
Bought by
Ramos Dalyn Joy D
Current Estimated Value
Home Financials for this Owner
Home Financials are based on the most recent Mortgage that was taken out on this home.
Original Mortgage
$167,741
Outstanding Balance
$108,791
Interest Rate
4.4%
Mortgage Type
FHA
Estimated Equity
$376,727
Purchase Details
Closed on
Apr 7, 2010
Sold by
Garcia Cesar E and Garcia Maria V
Bought by
Lenders Financial Group Llc
Home Financials for this Owner
Home Financials are based on the most recent Mortgage that was taken out on this home.
Original Mortgage
$167,741
Outstanding Balance
$108,791
Interest Rate
4.4%
Mortgage Type
FHA
Estimated Equity
$376,727
Purchase Details
Closed on
Aug 24, 2001
Sold by
The Forecast Group Lp
Bought by
Garcia Cesar E and Garcia Maria V
Home Financials for this Owner
Home Financials are based on the most recent Mortgage that was taken out on this home.
Original Mortgage
$231,750
Interest Rate
7.09%
Create a Home Valuation Report for This Property
The Home Valuation Report is an in-depth analysis detailing your home's value as well as a comparison with similar homes in the area
Home Values in the Area
Average Home Value in this Area
Purchase History
| Date | Buyer | Sale Price | Title Company |
|---|---|---|---|
| Ramos Dalyn Joy D | -- | Chicago Title Company | |
| Lenders Financial Group Llc | $127,500 | None Available | |
| Garcia Cesar E | $244,000 | Orange Coast Title |
Source: Public Records
Mortgage History
| Date | Status | Borrower | Loan Amount |
|---|---|---|---|
| Open | Ramos Dalyn Joy D | $167,741 | |
| Previous Owner | Garcia Cesar E | $231,750 |
Source: Public Records
Tax History Compared to Growth
Tax History
| Year | Tax Paid | Tax Assessment Tax Assessment Total Assessment is a certain percentage of the fair market value that is determined by local assessors to be the total taxable value of land and additions on the property. | Land | Improvement |
|---|---|---|---|---|
| 2025 | $3,337 | $219,425 | $54,208 | $165,217 |
| 2024 | $3,226 | $215,124 | $53,146 | $161,978 |
| 2023 | $3,076 | $210,906 | $52,104 | $158,802 |
| 2022 | $3,004 | $206,772 | $51,083 | $155,689 |
| 2021 | $2,945 | $202,719 | $50,082 | $152,637 |
| 2020 | $2,836 | $200,641 | $49,569 | $151,072 |
| 2019 | $2,789 | $196,708 | $48,598 | $148,110 |
| 2018 | $2,767 | $192,852 | $47,646 | $145,206 |
| 2017 | $2,718 | $189,071 | $46,712 | $142,359 |
| 2016 | $2,614 | $185,365 | $45,796 | $139,569 |
| 2014 | $3,544 | $179,006 | $44,225 | $134,781 |
Source: Public Records
Map
Nearby Homes
- 4135 Roma Ln
- 1702 Sicily St Unit 1
- 1817 Germain Ln
- 4116 Vercelli St
- 1903 Picasso Way
- 1914 Picasso Way
- 1929 Picasso Way
- 4550 Pissarro Dr
- 2115 Picasso Way
- 4331 Eiffel Dr
- 4150 Degas Ct
- 1831 Oakley Ct
- 1851 Oakley Ct
- 1611 Magnum Ct
- 3779 Zeally Ln
- 1944 Erickson Cir
- 1890 Gordon Verner Cir
- 4910 Hearthwood Ct
- 1526 Kimiyo St
- 2032 Black Rose Ln