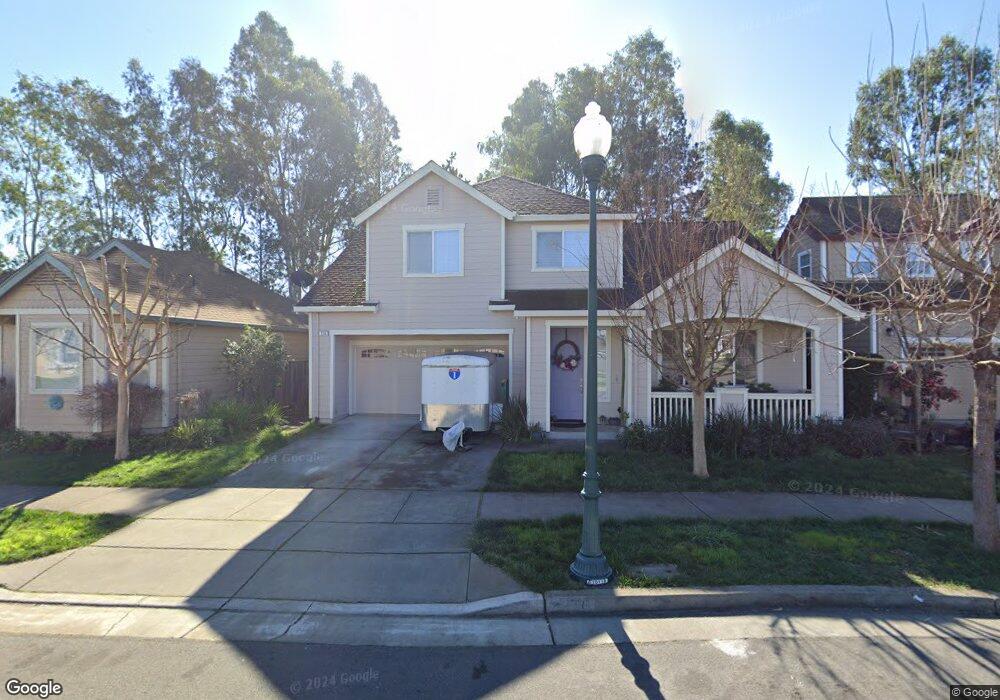
2158 Northfield Dr Santa Rosa, CA 95403
Northwest Santa Rosa NeighborhoodEstimated Value: $656,735 - $706,000
3
Beds
3
Baths
1,505
Sq Ft
$456/Sq Ft
Est. Value
About This Home
This home is located at 2158 Northfield Dr, Santa Rosa, CA 95403 and is currently estimated at $686,684, approximately $456 per square foot. 2158 Northfield Dr is a home located in Sonoma County with nearby schools including James Monroe Elementary School, Hilliard Comstock Middle School, and Piner High School.
Ownership History
Date
Name
Owned For
Owner Type
Purchase Details
Closed on
Jun 9, 2010
Sold by
Aurora Loan Services Llc
Bought by
Wang Kung Liang and Wang Shu Fen
Current Estimated Value
Purchase Details
Closed on
Apr 13, 2010
Sold by
Prom Sameth
Bought by
Aurora Loan Services Llc
Purchase Details
Closed on
Dec 20, 2006
Sold by
Broderick Sameth Prom and Prom Sameth
Bought by
Prom Broderick Larypatrick and Prom Broderick Sameth
Purchase Details
Closed on
Jun 27, 2006
Sold by
Broderick Larry
Bought by
Prom Sameth
Home Financials for this Owner
Home Financials are based on the most recent Mortgage that was taken out on this home.
Original Mortgage
$463,200
Interest Rate
7.25%
Mortgage Type
Purchase Money Mortgage
Create a Home Valuation Report for This Property
The Home Valuation Report is an in-depth analysis detailing your home's value as well as a comparison with similar homes in the area
Home Values in the Area
Average Home Value in this Area
Purchase History
| Date | Buyer | Sale Price | Title Company |
|---|---|---|---|
| Wang Kung Liang | $290,000 | North American Title Co Inc | |
| Aurora Loan Services Llc | $506,637 | Accommodation | |
| Prom Broderick Larypatrick | -- | None Available | |
| Prom Sameth | -- | Financial Title Company | |
| Prom Sameth | $579,000 | Financial Title Company |
Source: Public Records
Mortgage History
| Date | Status | Borrower | Loan Amount |
|---|---|---|---|
| Previous Owner | Prom Sameth | $463,200 |
Source: Public Records
Tax History Compared to Growth
Tax History
| Year | Tax Paid | Tax Assessment Tax Assessment Total Assessment is a certain percentage of the fair market value that is determined by local assessors to be the total taxable value of land and additions on the property. | Land | Improvement |
|---|---|---|---|---|
| 2025 | $4,234 | $374,321 | $122,620 | $251,701 |
| 2024 | $4,234 | $366,982 | $120,216 | $246,766 |
| 2023 | $4,234 | $359,787 | $117,859 | $241,928 |
| 2022 | $3,911 | $352,734 | $115,549 | $237,185 |
| 2021 | $3,864 | $345,819 | $113,284 | $232,535 |
| 2020 | $3,855 | $342,274 | $112,123 | $230,151 |
| 2019 | $3,835 | $335,564 | $109,925 | $225,639 |
| 2018 | $3,814 | $328,985 | $107,770 | $221,215 |
| 2017 | $3,746 | $322,535 | $105,657 | $216,878 |
| 2016 | $3,717 | $316,212 | $103,586 | $212,626 |
| 2015 | $3,605 | $311,464 | $102,031 | $209,433 |
| 2014 | $3,385 | $305,364 | $100,033 | $205,331 |
Source: Public Records
Map
Nearby Homes
- 2110 Northfield Dr
- 2976 Bay Village Ave
- 1906 Genoa Place
- 1905 Belair Way
- 2320 Masterson Ct
- 2324 Hickock Ct
- 1945 Piner Rd Unit 16
- 1945 Piner Rd Unit 148
- 1945 Piner Rd Unit 185
- 1945 Piner Rd Unit 47
- 1945 Piner Rd Unit 105
- 1945 Piner Rd Unit 189
- 1921 Bronco St
- 2137 Avilar Place
- 2299 San Miguel Ave
- 2234 Gold Leaf Ln
- 2522 Sam Dr
- 2289 Claiborne Cir
- 2829 Apple Valley Ln
- 2311 San Miguel Ave
- 2152 Northfield Dr
- 1725 Waltzer Rd
- 1731 Waltzer Rd
- 2146 Northfield Dr
- 1737 Waltzer Rd
- 1734 Waltzer Rd
- 2147 Northfield Dr
- 2140 Northfield Dr
- 1743 Waltzer Rd
- 2141 Northfield Dr
- 2175 Floral Way
- 1738 Waltzer Rd
- 2135 Northfield Dr
- 1749 Waltzer Rd
- 1742 Waltzer Rd
- 2134 Northfield Dr
- 1755 Waltzer Rd
- 1756 Waltzer Rd
- 1746 Waltzer Rd
- 2128 Northfield Dr