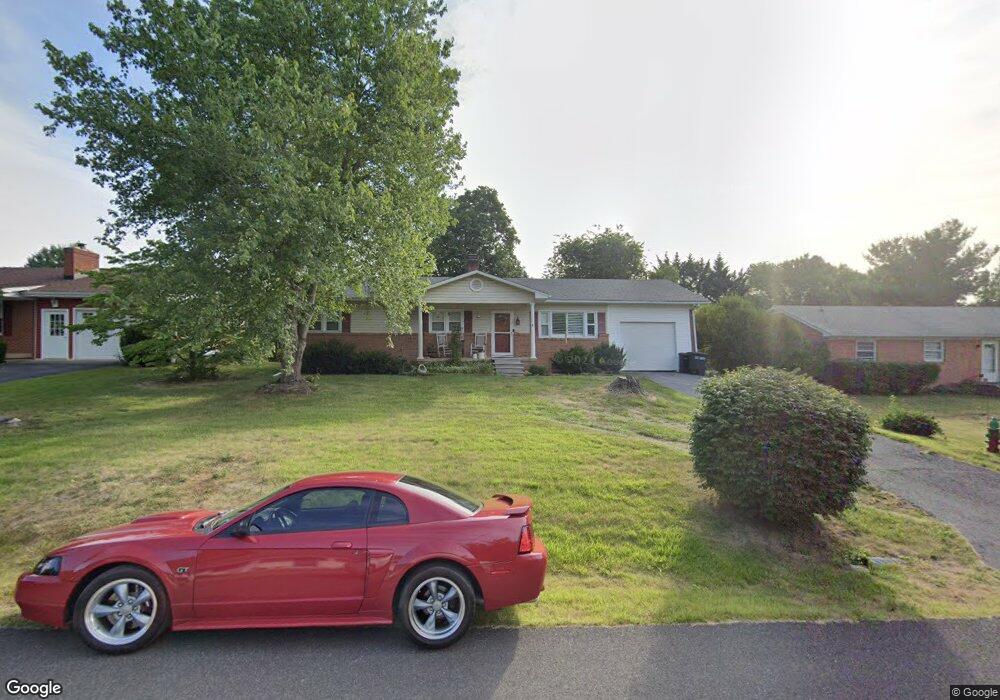
2158 Shawn Dr Middletown, VA 22645
Estimated Value: $349,996 - $364,000
3
Beds
3
Baths
1,288
Sq Ft
$278/Sq Ft
Est. Value
About This Home
This home is located at 2158 Shawn Dr, Middletown, VA 22645 and is currently estimated at $357,999, approximately $277 per square foot. 2158 Shawn Dr is a home located in Frederick County with nearby schools including Middletown Elementary School and Sherando High School.
Ownership History
Date
Name
Owned For
Owner Type
Purchase Details
Closed on
Oct 19, 2004
Sold by
Williams Zedia
Bought by
Evans Gary
Current Estimated Value
Home Financials for this Owner
Home Financials are based on the most recent Mortgage that was taken out on this home.
Original Mortgage
$110,000
Outstanding Balance
$54,769
Interest Rate
5.85%
Mortgage Type
New Conventional
Estimated Equity
$303,230
Create a Home Valuation Report for This Property
The Home Valuation Report is an in-depth analysis detailing your home's value as well as a comparison with similar homes in the area
Home Values in the Area
Average Home Value in this Area
Purchase History
| Date | Buyer | Sale Price | Title Company |
|---|---|---|---|
| Evans Gary | $209,900 | -- |
Source: Public Records
Mortgage History
| Date | Status | Borrower | Loan Amount |
|---|---|---|---|
| Open | Evans Gary | $110,000 |
Source: Public Records
Tax History Compared to Growth
Tax History
| Year | Tax Paid | Tax Assessment Tax Assessment Total Assessment is a certain percentage of the fair market value that is determined by local assessors to be the total taxable value of land and additions on the property. | Land | Improvement |
|---|---|---|---|---|
| 2025 | $1,410 | $293,760 | $83,000 | $210,760 |
| 2024 | $638 | $250,100 | $67,000 | $183,100 |
| 2023 | $1,276 | $250,100 | $67,000 | $183,100 |
| 2022 | $1,251 | $205,100 | $62,000 | $143,100 |
| 2021 | $1,251 | $205,100 | $62,000 | $143,100 |
| 2020 | $1,158 | $189,800 | $62,000 | $127,800 |
| 2019 | $1,158 | $189,800 | $62,000 | $127,800 |
| 2018 | $1,061 | $173,900 | $62,000 | $111,900 |
| 2017 | $1,043 | $173,900 | $62,000 | $111,900 |
| 2016 | $959 | $159,800 | $49,500 | $110,300 |
| 2015 | $895 | $159,800 | $49,500 | $110,300 |
| 2014 | $454 | $152,300 | $49,500 | $102,800 |
Source: Public Records
Map
Nearby Homes
- 2425 Third St
- 2140 Sixth St
- 119 Kensington Cir
- 2432 Laurel Ln
- 104 Midsummer Ln
- 106 Midsummer Ln
- 120 Midsummer Ln
- 102 Midsummer Ln
- 100 Midsummer Ln
- Onyx Plan at Middletown Place - Seasons
- Coral Plan at Middletown Place - Seasons
- 2085 Chapel Rd
- 226 Reliance Rd
- 100 Coville St
- 0 Reliance Rd Unit VAFV2013246
- 0 Reliance Rd Unit VAWR139520
- 0 Reliance Rd Unit VAFV2024656
- 1115 Chapel Rd
- 6519 Valley Pike
- 190 Newell Dr