Estimated Value: $149,000 - $172,269
2
Beds
2
Baths
1,286
Sq Ft
$125/Sq Ft
Est. Value
About This Home
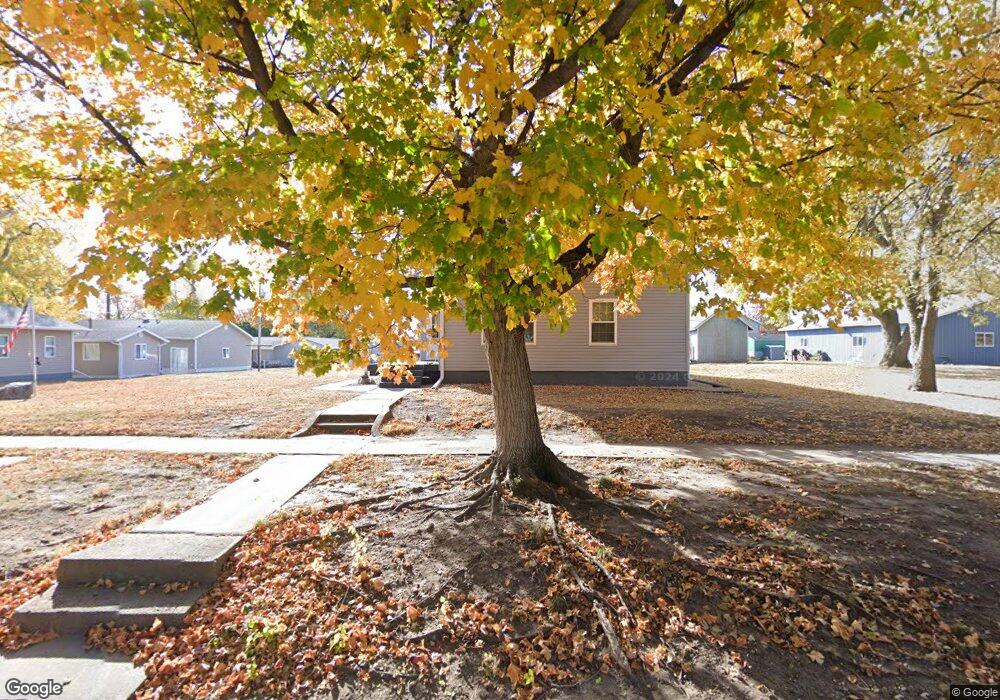
This home is located at 216 13th St, Boone, IA 50036 and is currently estimated at $160,567, approximately $124 per square foot. 216 13th St is a home located in Boone County with nearby schools including Boone High School, Trinity Lutheran School, and Sacred Heart School.
Ownership History
Date
Name
Owned For
Owner Type
Purchase Details
Closed on
Jul 2, 2025
Sold by
Efkamp Joanne C
Bought by
Muhlenburg Bruce and Muhlenburg Deborah
Current Estimated Value
Home Financials for this Owner
Home Financials are based on the most recent Mortgage that was taken out on this home.
Original Mortgage
$215,000
Outstanding Balance
$214,637
Interest Rate
6.86%
Mortgage Type
VA
Estimated Equity
-$54,070
Create a Home Valuation Report for This Property
The Home Valuation Report is an in-depth analysis detailing your home's value as well as a comparison with similar homes in the area
Home Values in the Area
Average Home Value in this Area
Purchase History
| Date | Buyer | Sale Price | Title Company |
|---|---|---|---|
| Muhlenburg Bruce | $215,000 | None Listed On Document | |
| Muhlenburg Bruce | $215,000 | None Listed On Document |
Source: Public Records
Mortgage History
| Date | Status | Borrower | Loan Amount |
|---|---|---|---|
| Open | Muhlenburg Bruce | $215,000 | |
| Closed | Muhlenburg Bruce | $215,000 |
Source: Public Records
Tax History Compared to Growth
Tax History
| Year | Tax Paid | Tax Assessment Tax Assessment Total Assessment is a certain percentage of the fair market value that is determined by local assessors to be the total taxable value of land and additions on the property. | Land | Improvement |
|---|---|---|---|---|
| 2025 | $2,390 | $186,960 | $22,230 | $164,730 |
| 2024 | $2,390 | $140,027 | $15,876 | $124,151 |
| 2023 | $2,098 | $140,027 | $15,876 | $124,151 |
| 2022 | $2,178 | $109,262 | $7,938 | $101,324 |
| 2021 | $2,178 | $109,262 | $7,938 | $101,324 |
| 2020 | $2,208 | $105,559 | $7,938 | $97,621 |
| 2019 | $1,994 | $105,559 | $7,938 | $97,621 |
| 2018 | $1,974 | $92,693 | $0 | $0 |
| 2017 | $1,756 | $82,845 | $7,938 | $74,907 |
| 2016 | $1,702 | $82,845 | $7,938 | $74,907 |
| 2015 | $1,706 | $82,845 | $0 | $0 |
| 2014 | $1,650 | $82,845 | $0 | $0 |
Source: Public Records
Map
Nearby Homes