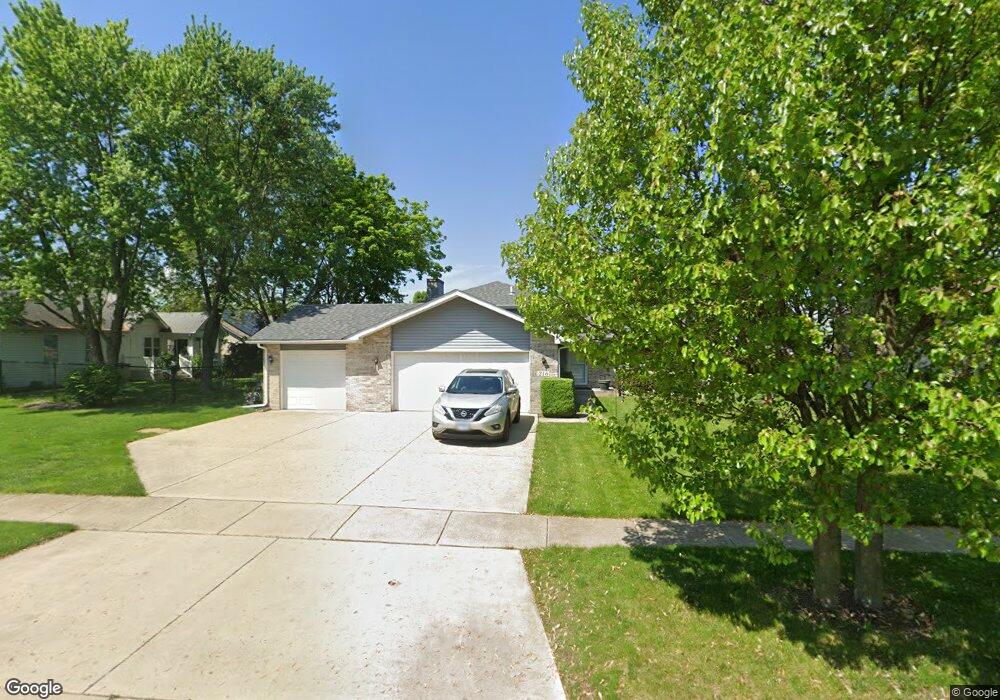
216 Deerpath Dr Unit 2 Oswego, IL 60543
Northwest Oswego NeighborhoodEstimated Value: $307,000 - $346,491
3
Beds
2
Baths
1,171
Sq Ft
$284/Sq Ft
Est. Value
About This Home
This home is located at 216 Deerpath Dr Unit 2, Oswego, IL 60543 and is currently estimated at $332,373, approximately $283 per square foot. 216 Deerpath Dr Unit 2 is a home located in Kendall County with nearby schools including Fox Chase Elementary School, Traughber Junior High School, and Oswego High School.
Ownership History
Date
Name
Owned For
Owner Type
Purchase Details
Closed on
Mar 3, 2025
Sold by
Perez Ismael and Perez Mary Helen
Bought by
Perez Ismael and Perez Mary Helen
Current Estimated Value
Purchase Details
Closed on
Oct 5, 2001
Sold by
Perez Ismael and Perez Mary H
Bought by
Perez Ismael
Home Financials for this Owner
Home Financials are based on the most recent Mortgage that was taken out on this home.
Original Mortgage
$121,600
Interest Rate
6.31%
Purchase Details
Closed on
Oct 30, 1997
Sold by
Strohl Christopher M and Strohl Laura A
Bought by
Perez Ismael and Perez Mary H
Home Financials for this Owner
Home Financials are based on the most recent Mortgage that was taken out on this home.
Original Mortgage
$140,600
Interest Rate
7.42%
Purchase Details
Closed on
Nov 24, 1993
Bought by
Strohl Christopher M
Create a Home Valuation Report for This Property
The Home Valuation Report is an in-depth analysis detailing your home's value as well as a comparison with similar homes in the area
Home Values in the Area
Average Home Value in this Area
Purchase History
| Date | Buyer | Sale Price | Title Company |
|---|---|---|---|
| Perez Ismael | -- | None Listed On Document | |
| Perez Ismael | -- | -- | |
| Perez Ismael | $148,000 | Wheatland Title | |
| Strohl Christopher M | $130,500 | -- |
Source: Public Records
Mortgage History
| Date | Status | Borrower | Loan Amount |
|---|---|---|---|
| Previous Owner | Perez Ismael | $121,600 | |
| Previous Owner | Perez Ismael | $140,600 | |
| Closed | Strohl Christopher M | -- |
Source: Public Records
Tax History
| Year | Tax Paid | Tax Assessment Tax Assessment Total Assessment is a certain percentage of the fair market value that is determined by local assessors to be the total taxable value of land and additions on the property. | Land | Improvement |
|---|---|---|---|---|
| 2024 | $7,572 | $100,096 | $14,485 | $85,611 |
| 2023 | $6,862 | $89,371 | $12,933 | $76,438 |
| 2022 | $6,862 | $81,992 | $11,865 | $70,127 |
| 2021 | $6,745 | $78,088 | $11,300 | $66,788 |
| 2020 | $6,739 | $77,315 | $11,188 | $66,127 |
| 2019 | $6,183 | $72,417 | $11,188 | $61,229 |
| 2018 | $5,919 | $71,200 | $11,000 | $60,200 |
| 2017 | $5,521 | $61,852 | $6,623 | $55,229 |
| 2016 | $5,570 | $61,554 | $17,007 | $44,547 |
| 2015 | $5,177 | $55,454 | $15,322 | $40,132 |
| 2014 | -- | $52,315 | $14,455 | $37,860 |
| 2013 | -- | $52,843 | $14,601 | $38,242 |
Source: Public Records
Map
Nearby Homes
- 123 Fox Chase Dr S
- 404 Beaver Ct Unit 3
- 116 River Mist Dr
- 135 River Mist Dr Unit 2
- 133 River Mist Dr Unit 3
- 2110 State Route 31
- 2240 State Route 31
- 505 Parkland Ct
- 1415 State Route 31
- 303 Fox Chase Dr N
- 2300 Light Rd Unit 209
- 125 Presidential Blvd Unit 3248
- 2600 Light Rd Unit 210
- 2600 Light Rd Unit 207
- 187 Eisenhower Dr
- 5055 U S 34
- 435 Fawn Dr
- 316 Ash Grove Ln
- 149 Willowwood Dr N
- 7.43 Acres Vacant La State Route 31
- 214 Deerpath Dr
- 218 Whitetail Crossing
- 220 Whitetail Crossing
- 224 Whitetail Crossing
- 222 Whitetail Crossing
- 212 Deerpath Dr Unit 2
- 226 Whitetail Crossing
- 215 Deerpath Dr
- 217 Deerpath Dr Unit 2
- 213 Deerpath Dr Unit 2
- 219 Deerpath Dr
- 210 Deerpath Dr
- 228 Whitetail Crossing
- 226 Deerpath Dr
- 211 Deerpath Dr
- 221 Deerpath Dr
- 219 Whitetail Crossing
- 230 Whitetail Crossing
- 231 Whitetail Crossing
- 233 Whitetail Crossing Unit 2
Your Personal Tour Guide
Ask me questions while you tour the home.