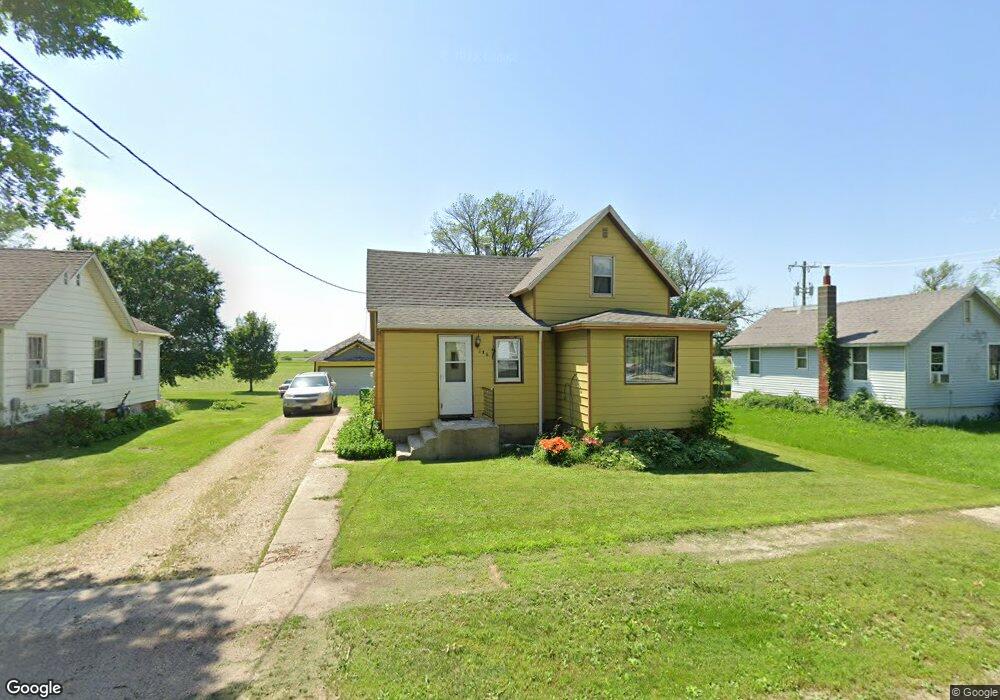
216 N Walnut St Kanawha, IA 50447
Estimated Value: $55,922 - $125,000
3
Beds
2
Baths
1,222
Sq Ft
$72/Sq Ft
Est. Value
About This Home
This home is located at 216 N Walnut St, Kanawha, IA 50447 and is currently estimated at $87,981, approximately $71 per square foot. 216 N Walnut St is a home located in Hancock County with nearby schools including West Hancock Elementary School, West Hancock Middle School, and West Hancock High School.
Ownership History
Date
Name
Owned For
Owner Type
Purchase Details
Closed on
Sep 14, 2012
Sold by
Johnson David E and Johnson Joyce V
Bought by
Gunn Thomas A and Gunn Dianne K
Current Estimated Value
Home Financials for this Owner
Home Financials are based on the most recent Mortgage that was taken out on this home.
Original Mortgage
$24,000
Interest Rate
3.56%
Mortgage Type
Future Advance Clause Open End Mortgage
Create a Home Valuation Report for This Property
The Home Valuation Report is an in-depth analysis detailing your home's value as well as a comparison with similar homes in the area
Home Values in the Area
Average Home Value in this Area
Purchase History
| Date | Buyer | Sale Price | Title Company |
|---|---|---|---|
| Gunn Thomas A | -- | None Available | |
| Johnson David E | $23,500 | None Available |
Source: Public Records
Mortgage History
| Date | Status | Borrower | Loan Amount |
|---|---|---|---|
| Previous Owner | Johnson David E | $24,000 |
Source: Public Records
Tax History Compared to Growth
Tax History
| Year | Tax Paid | Tax Assessment Tax Assessment Total Assessment is a certain percentage of the fair market value that is determined by local assessors to be the total taxable value of land and additions on the property. | Land | Improvement |
|---|---|---|---|---|
| 2025 | $128 | $38,040 | $7,430 | $30,610 |
| 2024 | $128 | $31,330 | $3,960 | $27,370 |
| 2023 | $350 | $31,330 | $3,960 | $27,370 |
| 2022 | $238 | $26,760 | $3,960 | $22,800 |
| 2021 | $302 | $20,860 | $3,960 | $16,900 |
| 2020 | $302 | $24,260 | $3,960 | $20,300 |
| 2019 | $310 | $24,260 | $3,960 | $20,300 |
| 2018 | $310 | $23,110 | $3,960 | $19,150 |
| 2017 | $310 | $22,930 | $0 | $0 |
| 2016 | $288 | $22,930 | $0 | $0 |
| 2015 | $288 | $22,460 | $0 | $0 |
| 2014 | $266 | $22,460 | $0 | $0 |
Source: Public Records
Map
Nearby Homes