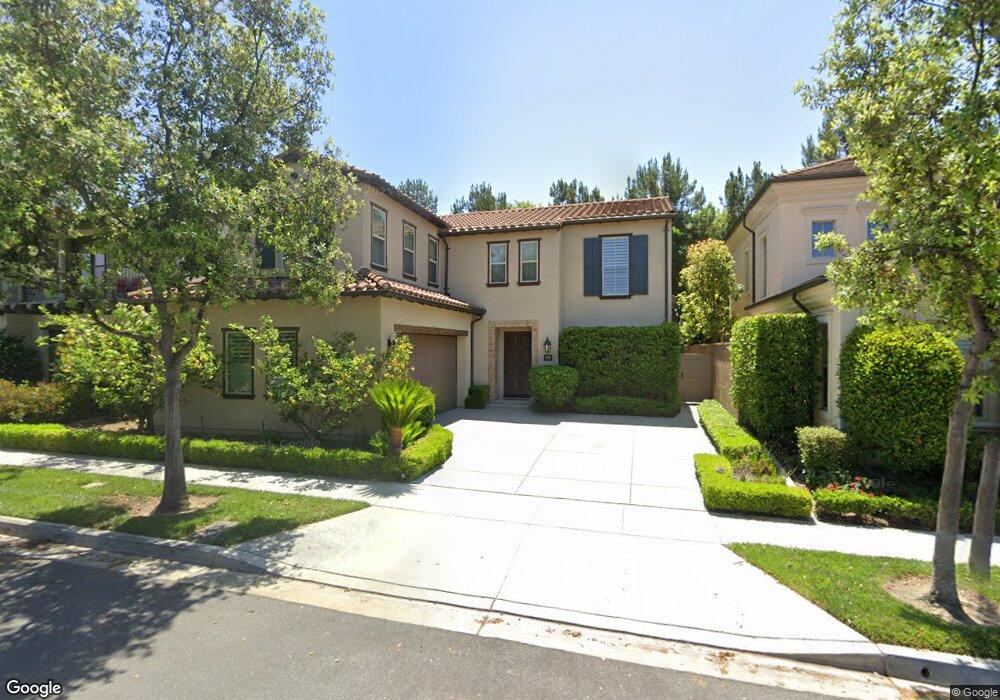
216 Shelbourne Irvine, CA 92620
Woodbury and Stonegate NeighborhoodEstimated Value: $2,295,690 - $2,432,000
4
Beds
4
Baths
2,653
Sq Ft
$898/Sq Ft
Est. Value
About This Home
This home is located at 216 Shelbourne, Irvine, CA 92620 and is currently estimated at $2,381,923, approximately $897 per square foot. 216 Shelbourne is a home with nearby schools including Stonegate Elementary School, Sierra Vista Middle School, and Northwood High School.
Ownership History
Date
Name
Owned For
Owner Type
Purchase Details
Closed on
Apr 22, 2021
Sold by
Amirdhalingam Mohan and Elango Sangeetha
Bought by
Amirdhalingam Mohan and Elango Sangeetha
Current Estimated Value
Purchase Details
Closed on
Dec 13, 2013
Sold by
Irvine Pacific L P
Bought by
Amirdhalingam Mohan and Elango Sangeetha
Home Financials for this Owner
Home Financials are based on the most recent Mortgage that was taken out on this home.
Original Mortgage
$625,500
Outstanding Balance
$469,539
Interest Rate
4.32%
Mortgage Type
New Conventional
Estimated Equity
$1,912,384
Create a Home Valuation Report for This Property
The Home Valuation Report is an in-depth analysis detailing your home's value as well as a comparison with similar homes in the area
Home Values in the Area
Average Home Value in this Area
Purchase History
| Date | Buyer | Sale Price | Title Company |
|---|---|---|---|
| Amirdhalingam Mohan | -- | None Available | |
| Amirdhalingam Mohan | $1,047,000 | First American Title Company |
Source: Public Records
Mortgage History
| Date | Status | Borrower | Loan Amount |
|---|---|---|---|
| Open | Amirdhalingam Mohan | $625,500 |
Source: Public Records
Tax History Compared to Growth
Tax History
| Year | Tax Paid | Tax Assessment Tax Assessment Total Assessment is a certain percentage of the fair market value that is determined by local assessors to be the total taxable value of land and additions on the property. | Land | Improvement |
|---|---|---|---|---|
| 2025 | $16,755 | $1,283,251 | $810,020 | $473,231 |
| 2024 | $16,755 | $1,258,090 | $794,138 | $463,952 |
| 2023 | $16,485 | $1,233,422 | $778,567 | $454,855 |
| 2022 | $16,220 | $1,209,238 | $763,301 | $445,937 |
| 2021 | $15,964 | $1,185,528 | $748,334 | $437,194 |
| 2020 | $15,843 | $1,173,372 | $740,660 | $432,712 |
| 2019 | $15,604 | $1,150,365 | $726,137 | $424,228 |
| 2018 | $14,454 | $1,127,809 | $711,899 | $415,910 |
| 2017 | $15,178 | $1,105,696 | $697,941 | $407,755 |
| 2016 | $14,961 | $1,084,016 | $684,256 | $399,760 |
| 2015 | $14,783 | $1,067,734 | $673,978 | $393,756 |
| 2014 | $14,839 | $1,046,819 | $660,776 | $386,043 |
Source: Public Records
Map
Nearby Homes