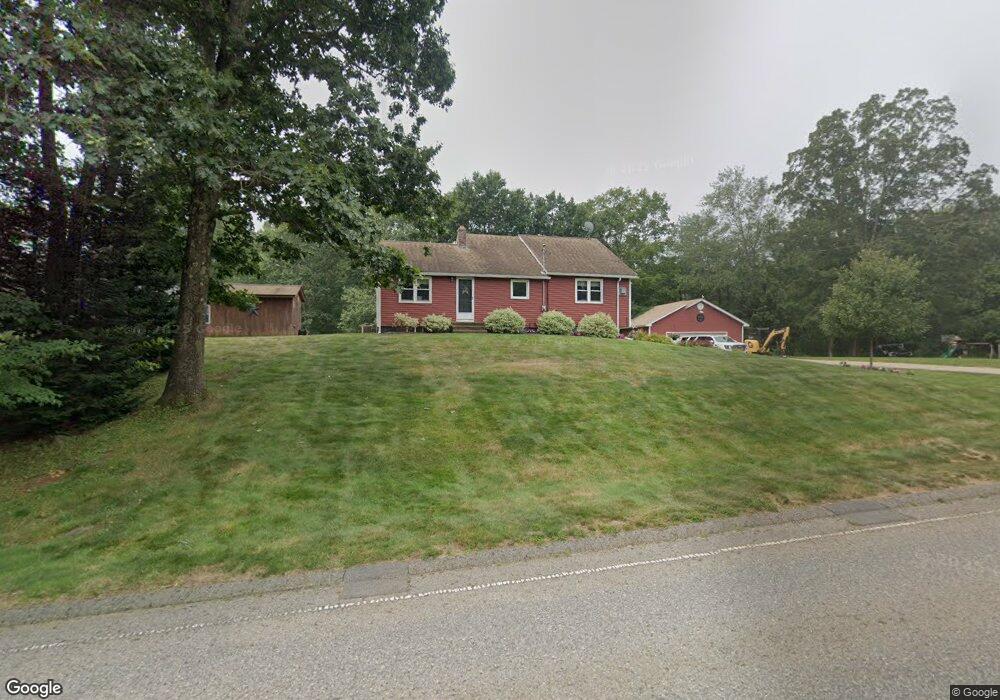
216 W Main St West Brookfield, MA 01585
Estimated Value: $353,495 - $394,000
2
Beds
1
Bath
1,248
Sq Ft
$299/Sq Ft
Est. Value
About This Home
This home is located at 216 W Main St, West Brookfield, MA 01585 and is currently estimated at $372,874, approximately $298 per square foot. 216 W Main St is a home located in Worcester County with nearby schools including Quaboag Regional High School.
Ownership History
Date
Name
Owned For
Owner Type
Purchase Details
Closed on
Jul 2, 2008
Sold by
Varley Jean M and Varley Terry A
Bought by
Sablack Chad W and Sablack Jennifer E
Current Estimated Value
Home Financials for this Owner
Home Financials are based on the most recent Mortgage that was taken out on this home.
Original Mortgage
$157,000
Interest Rate
6.01%
Mortgage Type
Purchase Money Mortgage
Create a Home Valuation Report for This Property
The Home Valuation Report is an in-depth analysis detailing your home's value as well as a comparison with similar homes in the area
Home Values in the Area
Average Home Value in this Area
Purchase History
| Date | Buyer | Sale Price | Title Company |
|---|---|---|---|
| Sablack Chad W | $197,000 | -- | |
| Sablack Chad W | $197,000 | -- | |
| Sablack Chad W | $197,000 | -- |
Source: Public Records
Mortgage History
| Date | Status | Borrower | Loan Amount |
|---|---|---|---|
| Open | Sablack Chad W | $145,970 | |
| Closed | Sablack Chad W | $20,000 | |
| Closed | Sablack Chad W | $157,000 |
Source: Public Records
Tax History Compared to Growth
Tax History
| Year | Tax Paid | Tax Assessment Tax Assessment Total Assessment is a certain percentage of the fair market value that is determined by local assessors to be the total taxable value of land and additions on the property. | Land | Improvement |
|---|---|---|---|---|
| 2025 | $3,116 | $289,100 | $57,000 | $232,100 |
| 2024 | $3,247 | $289,100 | $57,000 | $232,100 |
| 2023 | $3,177 | $265,000 | $51,700 | $213,300 |
| 2022 | $3,065 | $231,700 | $49,300 | $182,400 |
| 2021 | $3,005 | $214,200 | $49,300 | $164,900 |
| 2020 | $2,664 | $181,200 | $49,900 | $131,300 |
| 2019 | $3,838 | $181,200 | $49,900 | $131,300 |
| 2018 | $2,981 | $175,800 | $49,900 | $125,900 |
| 2017 | $2,860 | $178,100 | $50,500 | $127,600 |
| 2016 | $2,751 | $177,400 | $50,500 | $126,900 |
| 2015 | $2,657 | $177,400 | $50,500 | $126,900 |
Source: Public Records
Map
Nearby Homes
- 12 Hadley Path
- 16 Hadley Path
- 91 Lake Shore Dr
- 22 Beach Dr
- 3 Old Ware Rd
- 234 Wickaboag
- 25 Highland Trail
- 920 Old West Brookfield Rd
- 19 Pine Trail
- 940 Old West Brookfield Rd
- 91 W Main St
- 71 W Main St
- 9 Birch Hill Rd
- 7 Church Street Extension
- 4 E Main St
- 37 Central St
- 28 N Main St
- 11 Shea Rd
- 68 Stagecoach Rd
- 260 Wickaboag Valley Rd