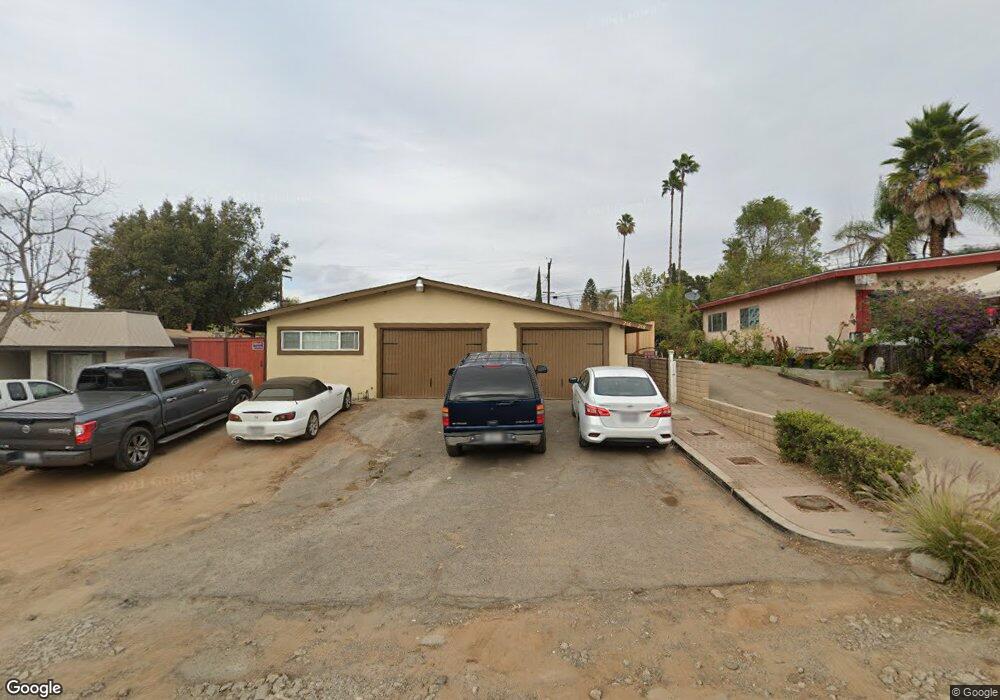
216 Woodcrest Ln Unit 18 Fallbrook, CA 92028
Estimated Value: $785,686 - $895,000
4
Beds
2
Baths
1,800
Sq Ft
$463/Sq Ft
Est. Value
About This Home
This home is located at 216 Woodcrest Ln Unit 18, Fallbrook, CA 92028 and is currently estimated at $832,922, approximately $462 per square foot. 216 Woodcrest Ln Unit 18 is a home located in San Diego County with nearby schools including William H. Frazier Elementary School, James E. Potter Intermediate School, and Fallbrook High School.
Ownership History
Date
Name
Owned For
Owner Type
Purchase Details
Closed on
May 19, 2017
Sold by
Ramirez Alfonso and Ramirez Ana
Bought by
Flores Placido Ramirez and Ramirez Cleotilde
Current Estimated Value
Home Financials for this Owner
Home Financials are based on the most recent Mortgage that was taken out on this home.
Original Mortgage
$274,500
Outstanding Balance
$53,849
Interest Rate
4.08%
Mortgage Type
New Conventional
Estimated Equity
$779,073
Purchase Details
Closed on
Oct 12, 2004
Sold by
Ramirez Alfonso and Ramirez Ana
Bought by
Ramirez Alfonso and Ramirez Ana
Home Financials for this Owner
Home Financials are based on the most recent Mortgage that was taken out on this home.
Original Mortgage
$297,000
Interest Rate
6.25%
Mortgage Type
Stand Alone Refi Refinance Of Original Loan
Purchase Details
Closed on
Jun 25, 1993
Purchase Details
Closed on
Apr 6, 1984
Create a Home Valuation Report for This Property
The Home Valuation Report is an in-depth analysis detailing your home's value as well as a comparison with similar homes in the area
Home Values in the Area
Average Home Value in this Area
Purchase History
| Date | Buyer | Sale Price | Title Company |
|---|---|---|---|
| Flores Placido Ramirez | -- | Lawyers Title | |
| Ramirez Alfonso | -- | United Title Company | |
| Ramirez Alfonso | -- | -- | |
| -- | $151,900 | -- | |
| -- | $105,000 | -- |
Source: Public Records
Mortgage History
| Date | Status | Borrower | Loan Amount |
|---|---|---|---|
| Open | Flores Placido Ramirez | $274,500 | |
| Closed | Ramirez Alfonso | $297,000 |
Source: Public Records
Tax History Compared to Growth
Tax History
| Year | Tax Paid | Tax Assessment Tax Assessment Total Assessment is a certain percentage of the fair market value that is determined by local assessors to be the total taxable value of land and additions on the property. | Land | Improvement |
|---|---|---|---|---|
| 2025 | $2,641 | $263,317 | $93,200 | $170,117 |
| 2024 | $2,641 | $258,155 | $91,373 | $166,782 |
| 2023 | $2,567 | $253,094 | $89,582 | $163,512 |
| 2022 | $2,565 | $248,132 | $87,826 | $160,306 |
| 2021 | $2,486 | $243,267 | $86,104 | $157,163 |
| 2020 | $2,510 | $240,774 | $85,222 | $155,552 |
| 2019 | $2,465 | $236,053 | $83,551 | $152,502 |
| 2018 | $2,425 | $231,425 | $81,913 | $149,512 |
| 2017 | $2,375 | $226,888 | $80,307 | $146,581 |
| 2016 | $2,313 | $222,440 | $78,733 | $143,707 |
| 2015 | $2,260 | $219,100 | $77,551 | $141,549 |
| 2014 | $2,216 | $214,809 | $76,032 | $138,777 |
Source: Public Records
Map
Nearby Homes
- 522 S Pico Ave
- 508 Village View Place
- 503 Potter St
- 212 S Wisconsin St
- 1206 Old Stage Rd
- 324 Shady Glen Dr
- 435 W Hawthorne St
- 720 W Fig St
- 519 Minnesota St
- 868 E Alvarado St Unit 46
- 705 Old Bridge Rd
- 678 Robby Way
- 425 E Dougherty St
- 1018 Morro Rd
- 1094 Felicidad Dr
- 710 Ceramic Ln
- 251 Royal Glen Dr
- 831 N Orange Ave
- 139 Almond St Unit 41
- 985 N Main Ave
- 208 Woodcrest Ln
- 226 Woodcrest Ln Unit 28
- 238 Woodcrest Ln Unit 40
- 202 Woodcrest Ln
- 246 Woodcrest Ln
- 246 Woodcrest Ln
- 215 Woodcrest Ln
- 223 Woodcrest Ln
- 203 E College St
- 211 E College St
- 235 Woodcrest Ln
- 139 E College St
- 427 S Orange Ave
- 223 E College St
- 241A Woodcrest Ln Unit D
- 417 S Orange Ave
- 407 S Orange Ave
- 127 E College St
- 301 Woodcrest Ln
- 233 E College St