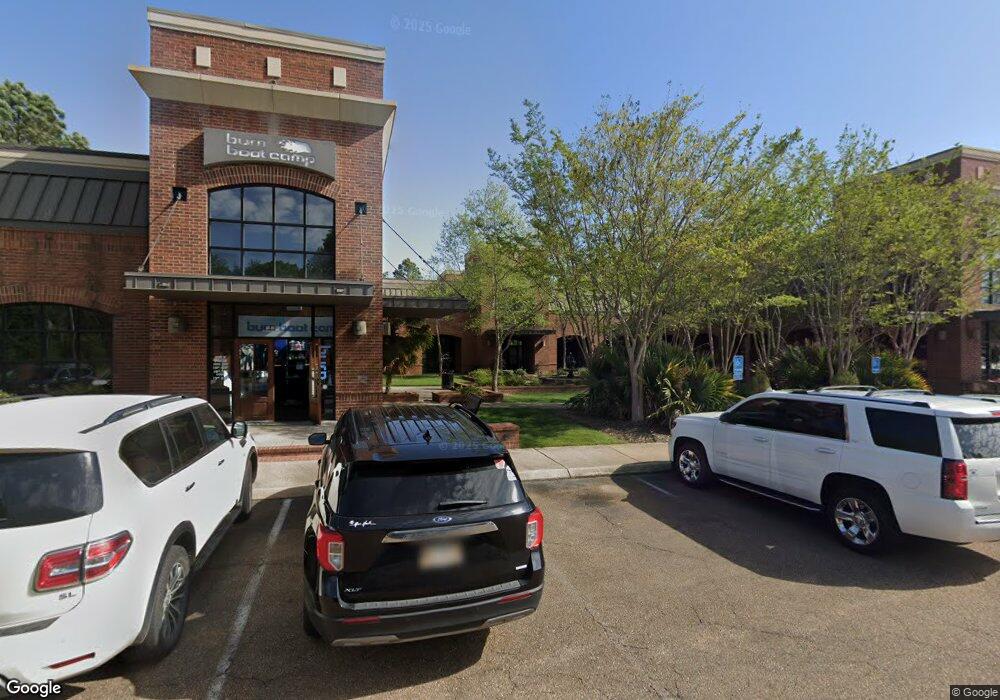
2160 Main St Madison, MS 39110
Estimated Value: $2,311,163
Studio
--
Bath
14,037
Sq Ft
$165/Sq Ft
Est. Value
About This Home
This home is located at 2160 Main St, Madison, MS 39110 and is currently estimated at $2,311,163, approximately $164 per square foot. 2160 Main St is a home located in Madison County with nearby schools including Madison Avenue Elementary, Madison Avenue Upper Elementary School, and Madison Middle School.
Ownership History
Date
Name
Owned For
Owner Type
Purchase Details
Closed on
Jun 24, 2019
Sold by
Tic Legacy 2 Llc
Bought by
2160 Main Llc
Current Estimated Value
Purchase Details
Closed on
May 11, 2015
Sold by
Grimmer Sue San Romani and Grimmer Beveley Sue
Bought by
Grimmer Gary G and The Gary G Grimmer Revocable Living Trus
Purchase Details
Closed on
Nov 25, 2012
Sold by
Chorman Tommy and Chorman Tina
Bought by
Chorman Tina
Purchase Details
Closed on
May 18, 2009
Sold by
For 1031 Legacy Main & High Llc
Bought by
Tic Legacy 2 Llc
Purchase Details
Closed on
Aug 24, 2006
Sold by
Grimmer Gary C
Bought by
Grimmer Gary C and Grimmer Beverly S
Purchase Details
Closed on
Mar 17, 2006
Sold by
Gooding Addison and Huff Harriet
Bought by
The Addition Gooding Revocable Living Tr
Purchase Details
Closed on
Oct 31, 2005
Sold by
Dbsi Legacy Llc
Bought by
For 1031 Legacy Main & High Llc
Purchase Details
Closed on
Oct 4, 2005
Sold by
Jackson Metro Properties Llc
Bought by
Co Dbsi Llc
Create a Home Valuation Report for This Property
The Home Valuation Report is an in-depth analysis detailing your home's value as well as a comparison with similar homes in the area
Home Values in the Area
Average Home Value in this Area
Purchase History
| Date | Buyer | Sale Price | Title Company |
|---|---|---|---|
| 2160 Main Llc | -- | -- | |
| Grimmer Gary G | -- | None Available | |
| Chorman Tina | -- | None Available | |
| Tic Legacy 2 Llc | $684 | None Available | |
| Grimmer Gary C | -- | None Available | |
| The Addition Gooding Revocable Living Tr | -- | None Available | |
| For 1031 Legacy Main & High Llc | -- | None Available | |
| Co Dbsi Llc | -- | None Available |
Source: Public Records
Tax History
| Year | Tax Paid | Tax Assessment Tax Assessment Total Assessment is a certain percentage of the fair market value that is determined by local assessors to be the total taxable value of land and additions on the property. | Land | Improvement |
|---|---|---|---|---|
| 2025 | $30,362 | $260,553 | $0 | $0 |
| 2024 | $30,362 | $260,553 | $0 | $0 |
| 2023 | $30,222 | $259,352 | $0 | $0 |
| 2022 | $30,222 | $259,352 | $0 | $0 |
| 2021 | $29,153 | $250,176 | $0 | $0 |
| 2020 | $29,153 | $250,176 | $0 | $0 |
| 2019 | $29,548 | $253,565 | $0 | $0 |
| 2018 | $29,548 | $253,565 | $0 | $0 |
| 2017 | $29,111 | $249,819 | $0 | $0 |
| 2016 | $29,111 | $249,819 | $0 | $0 |
| 2015 | $29,111 | $249,819 | $0 | $0 |
| 2014 | $29,111 | $249,819 | $0 | $0 |
Source: Public Records
Map
Nearby Homes
- 422 Summerville Dr
- 109 Brisage Dr
- 000 Mississippi 463
- 345 Avonlea Ln
- 220 Vintage Dr
- 290 Geneva Blvd
- 105 Victoria Place
- 0 Ebenezer Blvd Unit 4037341
- 1133 Highway 51
- 104 Willow Ct
- 129 Victoria Place
- 245 Mackey Dr
- 112 Brashear St
- 0 Harmony St
- 429 Pin Oak Dr
- 210 Amelia St
- 2026 Main St
- 3591 U S 51
- 303 Felicity St
- 0 Felicity St Unit 4112557
- 2160 Main St Unit F
- 2160 Main St Unit Suite F
- 2168 Main St
- 123 Main St
- 0 Heyward Ln Unit LOT 68 CHARLEST
- 0 Heyward Ln Unit Lot 92 533 1160546
- 0 Heyward Ln Unit Lot 93 1158824
- 0 Heyward Ln Unit LOT 16 1201255
- 0 Heyward Ln Unit LOT 16
- 0 Heyward Ln Unit Lot 93 1184587
- 132 Park Ave
- 7738 Old Canton Rd Unit D
- 7738 Old Canton Rd
- 136 Park Ave
- 7720 Old Canton Rd
- 128 Park Ave
- 124 Park Ave
- 7724 Old Canton Rd
- 7728 Old Canton Rd
- 302 Crepe Myrtle Ln
Your Personal Tour Guide
Ask me questions while you tour the home.