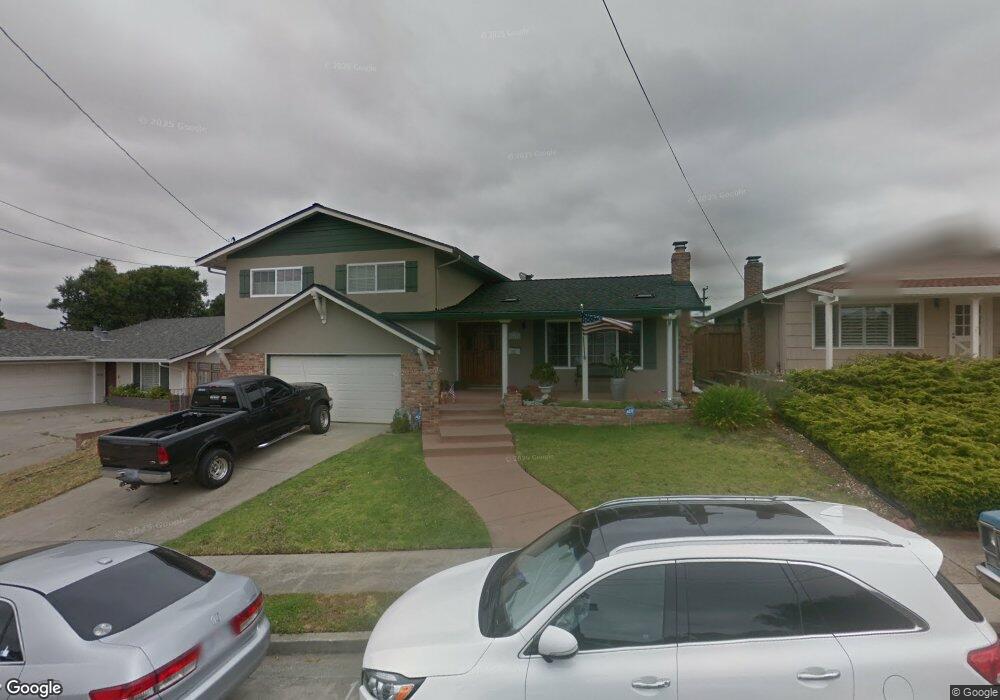
21612 Knoll Way Castro Valley, CA 94546
North Hayward NeighborhoodEstimated Value: $1,123,035 - $1,237,000
4
Beds
3
Baths
1,955
Sq Ft
$600/Sq Ft
Est. Value
About This Home
This home is located at 21612 Knoll Way, Castro Valley, CA 94546 and is currently estimated at $1,172,259, approximately $599 per square foot. 21612 Knoll Way is a home located in Alameda County with nearby schools including Strobridge Elementary School, Fairview Elementary School, and Bret Harte Middle School.
Ownership History
Date
Name
Owned For
Owner Type
Purchase Details
Closed on
Jul 16, 2001
Sold by
Leland Karen J and Leland Stephen F
Bought by
Young Shon D and Young Janice C
Current Estimated Value
Home Financials for this Owner
Home Financials are based on the most recent Mortgage that was taken out on this home.
Original Mortgage
$340,000
Outstanding Balance
$129,693
Interest Rate
7%
Estimated Equity
$1,042,566
Purchase Details
Closed on
Jan 21, 1998
Sold by
Kelly Tom and Kelly Heather
Bought by
Leland Karen J and Leland Stephen F
Home Financials for this Owner
Home Financials are based on the most recent Mortgage that was taken out on this home.
Original Mortgage
$208,000
Interest Rate
7.05%
Create a Home Valuation Report for This Property
The Home Valuation Report is an in-depth analysis detailing your home's value as well as a comparison with similar homes in the area
Home Values in the Area
Average Home Value in this Area
Purchase History
| Date | Buyer | Sale Price | Title Company |
|---|---|---|---|
| Young Shon D | $425,000 | First American Title Guarant | |
| Leland Karen J | $260,000 | North American Title Co |
Source: Public Records
Mortgage History
| Date | Status | Borrower | Loan Amount |
|---|---|---|---|
| Open | Young Shon D | $340,000 | |
| Previous Owner | Leland Karen J | $208,000 | |
| Closed | Leland Karen J | $26,000 |
Source: Public Records
Tax History Compared to Growth
Tax History
| Year | Tax Paid | Tax Assessment Tax Assessment Total Assessment is a certain percentage of the fair market value that is determined by local assessors to be the total taxable value of land and additions on the property. | Land | Improvement |
|---|---|---|---|---|
| 2025 | $8,094 | $626,434 | $188,343 | $445,091 |
| 2024 | $8,094 | $614,015 | $184,650 | $436,365 |
| 2023 | $8,002 | $608,841 | $181,030 | $427,811 |
| 2022 | $7,758 | $584,603 | $177,481 | $414,122 |
| 2021 | $7,667 | $573,005 | $174,001 | $406,004 |
| 2020 | $7,552 | $574,060 | $172,218 | $401,842 |
| 2019 | $7,587 | $562,805 | $168,841 | $393,964 |
| 2018 | $7,118 | $551,772 | $165,531 | $386,241 |
| 2017 | $6,941 | $540,956 | $162,287 | $378,669 |
| 2016 | $6,548 | $530,352 | $159,105 | $371,247 |
| 2015 | $6,406 | $522,388 | $156,716 | $365,672 |
| 2014 | $6,088 | $512,158 | $153,647 | $358,511 |
Source: Public Records
Map
Nearby Homes
- 21314 Gary Dr Unit 214
- 22103 Vista Del Plaza Ln Unit 15
- 22135 Sevilla Rd Unit 47
- 21239 Gary Dr Unit 317D
- 21239 Gary Dr Unit 316A
- 21103 Gary Dr Unit 303
- 21284 Tyee St
- 21259 Hobert St
- 21062 Gary Dr Unit 313
- 22134 Orange Ave
- 21117 Gary Dr Unit 106
- 21117 Gary Dr Unit 105
- 21235 Kahlert St
- 21109 Gary Dr Unit 209
- 1005 Imperial Place
- 2270 Vestal Ave
- 22234 Prospect St
- 20919 Locust St Unit K
- 2204 Lobert St
- 2234 Lobert St
- 21600 Knoll Way
- 21624 Knoll Way
- 21623 Gail Dr
- 21629 Gail Dr
- 21578 Knoll Way
- 21636 Knoll Way
- 21635 Gail Dr
- 21617 Gail Dr
- 21623 Knoll Way
- 21611 Knoll Way
- 21601 Knoll Way
- 21635 Knoll Way
- 21643 Gail Dr
- 21648 Knoll Way
- 21572 Knoll Way
- 21573 Knoll Way
- 21611 Gail Dr
- 21651 Gail Dr
- 21649 Knoll Way
- 21660 Knoll Way