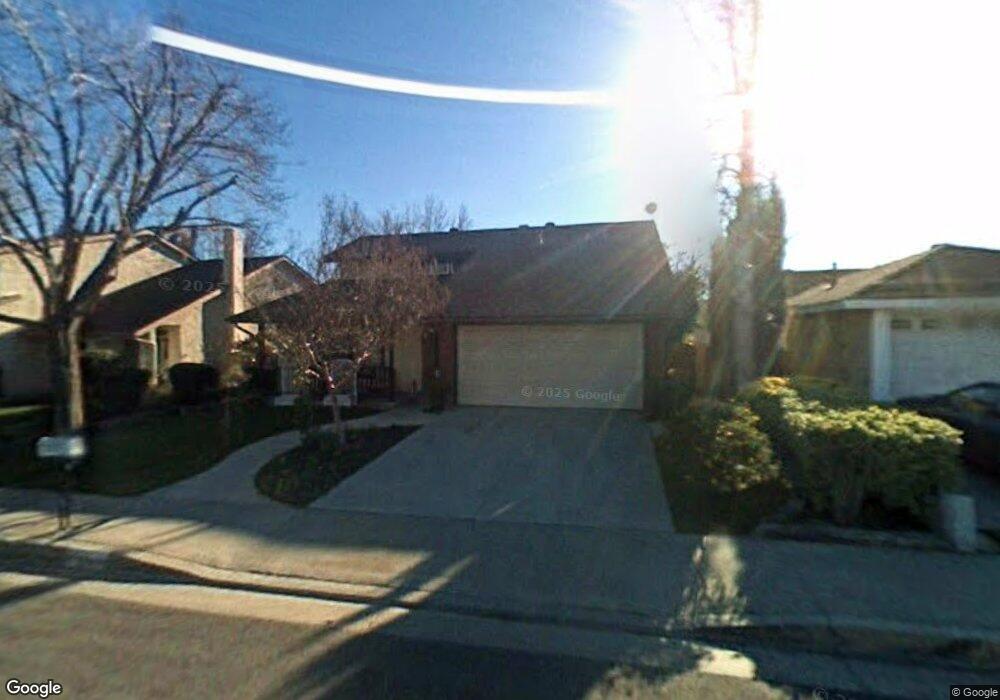
21612 Spice Ct Santa Clarita, CA 91350
Saugus NeighborhoodEstimated Value: $791,000 - $855,000
4
Beds
3
Baths
1,948
Sq Ft
$422/Sq Ft
Est. Value
About This Home
This home is located at 21612 Spice Ct, Santa Clarita, CA 91350 and is currently estimated at $821,333, approximately $421 per square foot. 21612 Spice Ct is a home located in Los Angeles County with nearby schools including Rosedell Elementary School, Arroyo Seco Junior High School, and Saugus High School.
Ownership History
Date
Name
Owned For
Owner Type
Purchase Details
Closed on
May 2, 2011
Sold by
Ruiz Otmaro
Bought by
Taniguchi Naomi
Current Estimated Value
Home Financials for this Owner
Home Financials are based on the most recent Mortgage that was taken out on this home.
Original Mortgage
$147,500
Outstanding Balance
$9,028
Interest Rate
4.77%
Mortgage Type
New Conventional
Estimated Equity
$812,305
Purchase Details
Closed on
Oct 20, 1997
Sold by
Barnes Melvin R
Bought by
Ruiz Otmaro and Taniguchi Ruiz Naomi
Home Financials for this Owner
Home Financials are based on the most recent Mortgage that was taken out on this home.
Original Mortgage
$146,400
Interest Rate
7.19%
Purchase Details
Closed on
Jan 3, 1994
Sold by
Barnes Heather R
Bought by
Barnes Melvin R
Home Financials for this Owner
Home Financials are based on the most recent Mortgage that was taken out on this home.
Original Mortgage
$161,250
Interest Rate
7.09%
Create a Home Valuation Report for This Property
The Home Valuation Report is an in-depth analysis detailing your home's value as well as a comparison with similar homes in the area
Home Values in the Area
Average Home Value in this Area
Purchase History
| Date | Buyer | Sale Price | Title Company |
|---|---|---|---|
| Taniguchi Naomi | -- | Placer Title Company | |
| Ruiz Otmaro | $183,000 | Investors Title Company | |
| Barnes Melvin R | -- | Old Republic Title Company |
Source: Public Records
Mortgage History
| Date | Status | Borrower | Loan Amount |
|---|---|---|---|
| Open | Taniguchi Naomi | $147,500 | |
| Previous Owner | Ruiz Otmaro | $146,400 | |
| Previous Owner | Barnes Melvin R | $161,250 |
Source: Public Records
Tax History Compared to Growth
Tax History
| Year | Tax Paid | Tax Assessment Tax Assessment Total Assessment is a certain percentage of the fair market value that is determined by local assessors to be the total taxable value of land and additions on the property. | Land | Improvement |
|---|---|---|---|---|
| 2025 | $4,403 | $313,600 | $102,176 | $211,424 |
| 2024 | $4,403 | $307,452 | $100,173 | $207,279 |
| 2023 | $4,279 | $301,424 | $98,209 | $203,215 |
| 2022 | $4,292 | $295,515 | $96,284 | $199,231 |
| 2021 | $4,213 | $289,722 | $94,397 | $195,325 |
| 2019 | $4,062 | $281,132 | $91,599 | $189,533 |
| 2018 | $3,949 | $275,620 | $89,803 | $185,817 |
| 2016 | $3,716 | $264,919 | $86,317 | $178,602 |
| 2015 | $3,579 | $260,941 | $85,021 | $175,920 |
| 2014 | $3,525 | $255,830 | $83,356 | $172,474 |
Source: Public Records
Map
Nearby Homes
- 21643 Masterson Ct
- 28050 Devon Ln
- 28123 Bobwhite Cir Unit 104
- 21741 Jeffers Ln
- 21560 Quinn Place
- 21929 Peppercorn Dr
- 27632 Kevin Place
- 27610 Kevin Place
- 27571 Caraway Ln
- 21983 Centurion Way
- 21965 Jeffers Ln
- 27620 Susan Beth Way Unit A
- 28303 Sycamore Dr
- 27547 Saffron Ln
- 21827 Centurion Way
- 21123 Avenida de Sonrisa
- 27502 Caraway Ln
- 28340 Sycamore Dr
- 27619 Ron Ridge Dr
- 27828 Parkvale Dr
- 21606 Spice Ct
- 21618 Spice Ct
- 21621 Allison Dr
- 21615 Allison Dr
- 21624 Spice Ct
- 21604 Spice Ct
- 21609 Allison Dr
- 21627 Allison Dr
- 21613 Spice Ct
- 21603 Allison Dr
- 27905 Caraway Ln
- 21619 Spice Ct
- 21631 Allison Dr
- 21630 Spice Ct
- 27909 Caraway Ln
- 21637 Allison Dr
- 21634 Spice Ct
- 21618 Allison Dr
- 27911 Oregano Cir
- 21631 Spice Ct