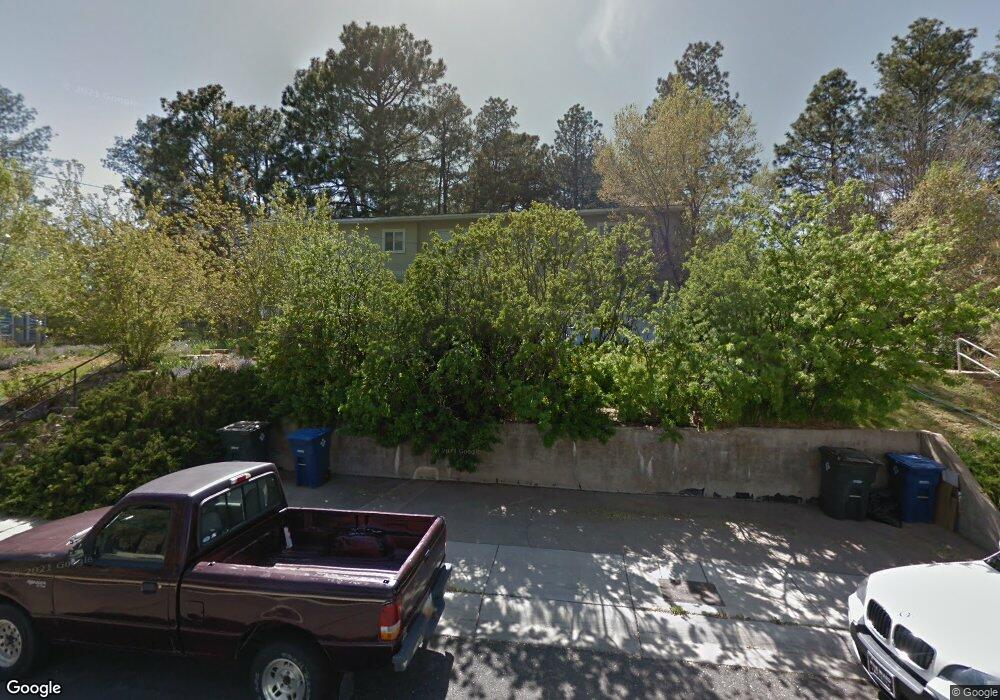
2165 45th St Unit a Los Alamos, NM 87544
Estimated Value: $330,000 - $389,000
3
Beds
1
Bath
1,349
Sq Ft
$266/Sq Ft
Est. Value
About This Home
This home is located at 2165 45th St Unit a, Los Alamos, NM 87544 and is currently estimated at $358,179, approximately $265 per square foot. 2165 45th St Unit a is a home located in Los Alamos County with nearby schools including Mountain Elementary School, Los Alamos Middle School, and Los Alamos High School.
Ownership History
Date
Name
Owned For
Owner Type
Purchase Details
Closed on
Mar 8, 2023
Sold by
Incorporated County Of Los Alamos
Bought by
Guenette Ellen Marie
Current Estimated Value
Purchase Details
Closed on
Sep 30, 2022
Sold by
Mockler Catherine
Bought by
Chu Vincent
Home Financials for this Owner
Home Financials are based on the most recent Mortgage that was taken out on this home.
Original Mortgage
$228,000
Interest Rate
4.55%
Mortgage Type
Balloon
Purchase Details
Closed on
Sep 28, 2022
Sold by
Five Oaks Investments Llc
Bought by
Mockler Catherine
Home Financials for this Owner
Home Financials are based on the most recent Mortgage that was taken out on this home.
Original Mortgage
$228,000
Interest Rate
4.55%
Mortgage Type
Balloon
Purchase Details
Closed on
Jul 8, 2022
Sold by
Five Oaks Investments Llc
Bought by
Mockler Catherine
Purchase Details
Closed on
Jan 1, 2010
Sold by
Nrr Inc
Bought by
Five Oaks Investments Llc and 45 65 Ab Land Trust
Create a Home Valuation Report for This Property
The Home Valuation Report is an in-depth analysis detailing your home's value as well as a comparison with similar homes in the area
Home Values in the Area
Average Home Value in this Area
Purchase History
| Date | Buyer | Sale Price | Title Company |
|---|---|---|---|
| Guenette Ellen Marie | -- | -- | |
| Chu Vincent | -- | -- | |
| Mockler Catherine | -- | -- | |
| Mockler Catherine | -- | None Listed On Document | |
| Five Oaks Investments Llc | -- | None Available |
Source: Public Records
Mortgage History
| Date | Status | Borrower | Loan Amount |
|---|---|---|---|
| Previous Owner | Chu Vincent | $228,000 |
Source: Public Records
Tax History Compared to Growth
Tax History
| Year | Tax Paid | Tax Assessment Tax Assessment Total Assessment is a certain percentage of the fair market value that is determined by local assessors to be the total taxable value of land and additions on the property. | Land | Improvement |
|---|---|---|---|---|
| 2025 | $2,168 | $96,840 | $25,700 | $71,140 |
| 2024 | $2,168 | $94,020 | $25,360 | $68,660 |
| 2023 | $2,191 | $91,290 | $24,910 | $66,380 |
| 2022 | $1,066 | $44,130 | $14,940 | $29,190 |
| 2021 | $1,032 | $42,850 | $14,670 | $28,180 |
| 2020 | $1,021 | $41,600 | $14,430 | $27,170 |
| 2019 | $974 | $39,080 | $14,150 | $24,930 |
| 2018 | $952 | $37,940 | $13,880 | $24,060 |
| 2017 | $930 | $36,840 | $13,560 | $23,280 |
| 2016 | $872 | $35,770 | $13,560 | $22,210 |
| 2015 | $855 | $35,010 | $13,250 | $21,760 |
| 2014 | $781 | $34,570 | $13,250 | $21,320 |
| 2013 | $875 | $38,780 | $15,250 | $23,530 |
| 2011 | $883 | $40,990 | $15,720 | $25,270 |
Source: Public Records
Map
Nearby Homes
- 2356 45th St Unit A
- 4714 Quemazon
- 4131 Arkansas Ave Unit D
- 4039 Sycamore St
- 4039 Sycamore St Unit b
- 4715 Quemazon
- 5385 Quemazon
- 4780 Brisa Del Bosque
- 5020 Hermosura
- 4226 Alabama Ave
- 1620 Sonrisa
- 1650 Sereno
- 1511 43rd St Unit A and B
- 1459 46th St
- 2241 34th St
- 3546 Questa Dr
- 3511 Arizona Ave
- 3496 Questa Dr
- 3483 Questa Dr
- 3460 Pueblo Dr