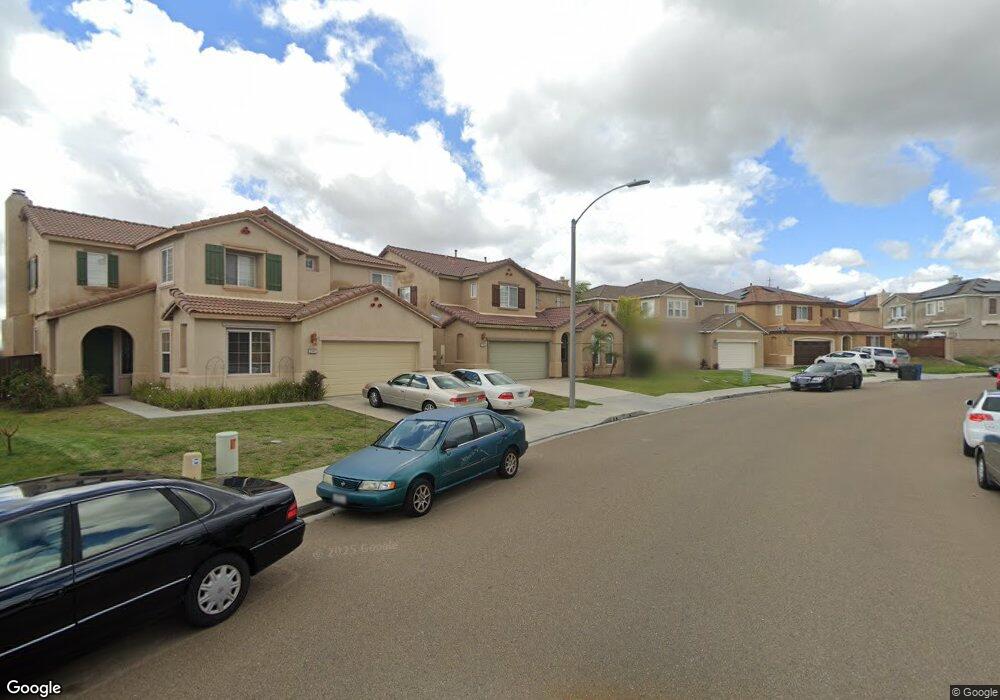
2165 Plaza Kadie Chula Vista, CA 91914
San Miguel Ranch NeighborhoodEstimated Value: $1,121,967 - $1,187,000
3
Beds
3
Baths
2,616
Sq Ft
$445/Sq Ft
Est. Value
About This Home
This home is located at 2165 Plaza Kadie, Chula Vista, CA 91914 and is currently estimated at $1,163,242, approximately $444 per square foot. 2165 Plaza Kadie is a home located in San Diego County with nearby schools including Liberty Elementary School, Eastlake Middle School, and Eastlake High School.
Ownership History
Date
Name
Owned For
Owner Type
Purchase Details
Closed on
Jul 15, 2008
Sold by
Equifirst Corp
Bought by
Weeks Greg and Weeks Norma B
Current Estimated Value
Home Financials for this Owner
Home Financials are based on the most recent Mortgage that was taken out on this home.
Original Mortgage
$441,626
Outstanding Balance
$288,353
Interest Rate
6.31%
Mortgage Type
FHA
Estimated Equity
$874,889
Purchase Details
Closed on
Dec 18, 2007
Sold by
Moss Scott H and Moss Yvonne
Bought by
Equifirst Corp
Purchase Details
Closed on
Nov 21, 2006
Sold by
Moss Scott H
Bought by
Moss Scott H and Moss Yvonne
Home Financials for this Owner
Home Financials are based on the most recent Mortgage that was taken out on this home.
Original Mortgage
$573,750
Interest Rate
10.19%
Mortgage Type
Balloon
Purchase Details
Closed on
Mar 29, 2004
Sold by
Altamira Development Co Llc
Bought by
Moss Scott H
Home Financials for this Owner
Home Financials are based on the most recent Mortgage that was taken out on this home.
Original Mortgage
$443,500
Interest Rate
5%
Mortgage Type
Unknown
Create a Home Valuation Report for This Property
The Home Valuation Report is an in-depth analysis detailing your home's value as well as a comparison with similar homes in the area
Home Values in the Area
Average Home Value in this Area
Purchase History
| Date | Buyer | Sale Price | Title Company |
|---|---|---|---|
| Weeks Greg | $458,000 | Chicago Title Company | |
| Equifirst Corp | $518,623 | Accommodation | |
| Moss Scott H | -- | Chicago Title | |
| Moss Scott H | $554,500 | Chicago Title Co |
Source: Public Records
Mortgage History
| Date | Status | Borrower | Loan Amount |
|---|---|---|---|
| Open | Weeks Greg | $441,626 | |
| Previous Owner | Moss Scott H | $573,750 | |
| Previous Owner | Moss Scott H | $443,500 | |
| Closed | Moss Scott H | $35,000 |
Source: Public Records
Tax History Compared to Growth
Tax History
| Year | Tax Paid | Tax Assessment Tax Assessment Total Assessment is a certain percentage of the fair market value that is determined by local assessors to be the total taxable value of land and additions on the property. | Land | Improvement |
|---|---|---|---|---|
| 2025 | $9,059 | $589,775 | $310,410 | $279,365 |
| 2024 | $9,059 | $578,212 | $304,324 | $273,888 |
| 2023 | $8,918 | $566,875 | $298,357 | $268,518 |
| 2022 | $8,692 | $555,760 | $292,507 | $263,253 |
| 2021 | $8,516 | $544,864 | $286,772 | $258,092 |
| 2020 | $8,327 | $539,278 | $283,832 | $255,446 |
| 2019 | $8,137 | $528,705 | $278,267 | $250,438 |
| 2018 | $8,015 | $518,339 | $272,811 | $245,528 |
| 2017 | $12 | $508,176 | $267,462 | $240,714 |
| 2016 | $7,697 | $498,213 | $262,218 | $235,995 |
| 2015 | $7,644 | $490,731 | $258,280 | $232,451 |
| 2014 | -- | $481,119 | $253,221 | $227,898 |
Source: Public Records
Map
Nearby Homes
- 348 Plaza Los Osos
- 418 Corte Calypso
- 283 Aventura Dr Unit 12
- 380 Callesita Mariola
- 278 Avenida Loretta
- 262 Avenida Loretta
- 2170 Lago Ventana
- 2401 Paseo Los Gatos
- 1950 Rue Michelle
- 2180 Hamden Dr
- 2100 Northshore Dr Unit A
- 544 Rocking Horse Dr
- 732 Eastshore Terrace Unit 77
- 2018 Bridgeport
- 2151 Northshore Dr
- 742 Eastshore Terrace Unit 98
- 746 Eastshore Terrace Unit 108
- 2264 Huntington Point Rd Unit 102
- 750 Eastshore Terrace Unit 120
- 1833 Corte Galeana
- 2169 Plaza Kadie
- 2161 Plaza Kadie
- 2157 Plaza Kadie
- 2173 Plaza Kadie
- 2152 Plaza Kadie
- 2153 Plaza Kadie
- 352 Circulo Coronado
- 348 Circulo Coronado
- 364 Circulo Coronado
- 2148 Plaza Kadie
- 2149 Plaza Kadie
- 344 Circulo Coronado
- 368 Circulo Coronado
- 2144 Plaza Kadie
- 340 Circulo Coronado
- 2140 Plaza Kadie
- 2145 Plaza Kadie
- 2141 Plaza Kadie
- 372 Circulo Coronado
- 336 Circulo Coronado