Estimated Value: $691,000 - $827,942
3
Beds
2
Baths
3,692
Sq Ft
$212/Sq Ft
Est. Value
About This Home
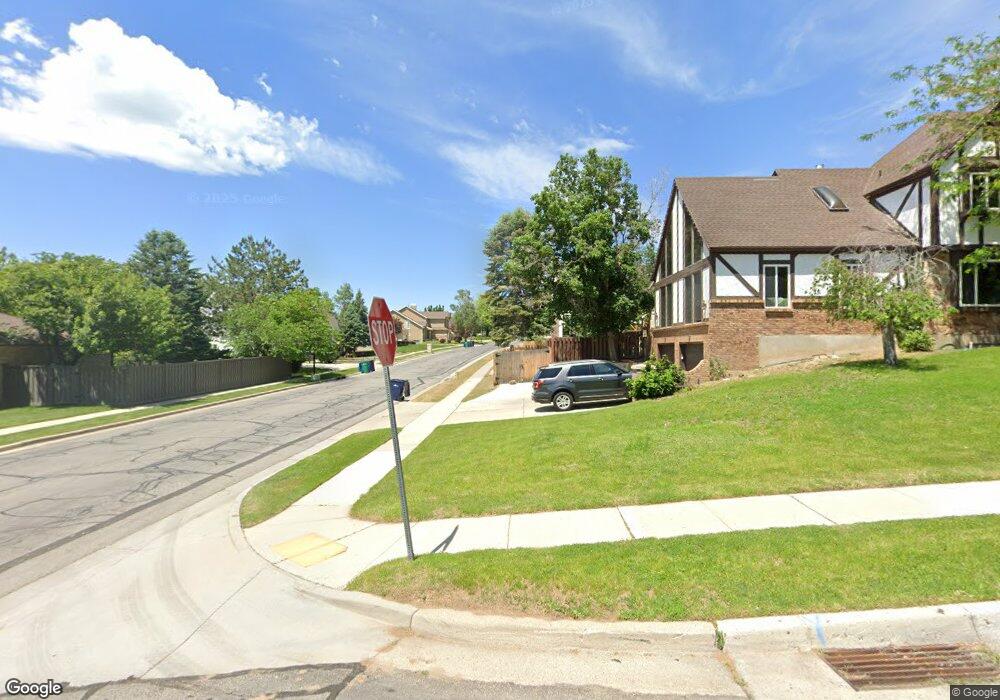
This home is located at 2167 E 11620 S, Sandy, UT 84092 and is currently estimated at $782,236, approximately $211 per square foot. 2167 E 11620 S is a home located in Salt Lake County with nearby schools including Summit Academy - Draper Elementary Campus, Challenger School - Sandy, and Blessed Sacrament Catholic School.
Ownership History
Date
Name
Owned For
Owner Type
Purchase Details
Closed on
Apr 27, 2016
Sold by
Bell Jacob
Bought by
Bell Jacob and Bell Debbie M
Current Estimated Value
Purchase Details
Closed on
Jul 31, 2013
Sold by
Davis John Wayne and Davis Deborah Ann
Bought by
Bell Jacob
Home Financials for this Owner
Home Financials are based on the most recent Mortgage that was taken out on this home.
Original Mortgage
$319,113
Outstanding Balance
$231,551
Interest Rate
3.87%
Mortgage Type
FHA
Estimated Equity
$550,685
Purchase Details
Closed on
Nov 10, 1993
Sold by
Sudweeks J Trevor and Sudweeks Korrie T
Bought by
Davis John Wayne and Davis Deborah Ann
Home Financials for this Owner
Home Financials are based on the most recent Mortgage that was taken out on this home.
Original Mortgage
$147,900
Interest Rate
6.91%
Create a Home Valuation Report for This Property
The Home Valuation Report is an in-depth analysis detailing your home's value as well as a comparison with similar homes in the area
Home Values in the Area
Average Home Value in this Area
Purchase History
| Date | Buyer | Sale Price | Title Company |
|---|---|---|---|
| Bell Jacob | -- | Benchmark Title Ins Agcy | |
| Bell Jacob | -- | Meridian Title | |
| Davis John Wayne | -- | -- |
Source: Public Records
Mortgage History
| Date | Status | Borrower | Loan Amount |
|---|---|---|---|
| Open | Bell Jacob | $319,113 | |
| Previous Owner | Davis John Wayne | $147,900 |
Source: Public Records
Tax History
| Year | Tax Paid | Tax Assessment Tax Assessment Total Assessment is a certain percentage of the fair market value that is determined by local assessors to be the total taxable value of land and additions on the property. | Land | Improvement |
|---|---|---|---|---|
| 2025 | $3,787 | $753,400 | $268,500 | $484,900 |
| 2024 | $3,787 | $716,100 | $258,400 | $457,700 |
| 2023 | $3,519 | $664,800 | $248,400 | $416,400 |
| 2022 | $3,550 | $655,700 | $243,600 | $412,100 |
| 2021 | $3,207 | $504,400 | $211,800 | $292,600 |
| 2020 | $3,028 | $449,700 | $194,400 | $255,300 |
| 2019 | $3,070 | $445,000 | $183,400 | $261,600 |
| 2016 | $2,589 | $363,400 | $183,400 | $180,000 |
Source: Public Records
Map
Nearby Homes
- 2232 E Lone Eagle Ln
- 2192 E High Mesa Dr
- 2250 High Mountain Dr
- 11446 S 2320 E
- 2234 E Willow Brook Way
- 2373 E Bear Hills Cir
- 11129 S 2125 E
- 12056 S Cortina Crest Dr
- 35 E Lone Hollow Dr
- 11318 Canyon Falls Ln
- 7 Rollingwood Ln
- 18 Snow Forest Ln
- 11551 S Woodhampton Dr
- 1 Quietwood Ln
- 1 Cross Hill Ln
- 16 Gatehouse Ln
- 3 Snow Forest Cove Unit 1039
- 1653 Crescent View Dr
- 5 Quietwood Ln
- 11341 S Silver Buckle Way
- 2177 E 11620 S
- 11617 Terendale Ln
- 11591 Terendale Ln
- 11591 S Terendale Ln
- 2174 Pinecrest Ln
- 2174 E Pinecrest Ln
- 2187 E 11620 S
- 11639 Terendale Ln
- 11632 S Carrington Ct
- 11632 Carrington Ct
- 11573 S Terendale Ln
- 11573 Terendale Ln
- 11638 Terendale Ln
- 11638 S Terendale Ln
- 12626 E Pine Crest Ln Unit 1
- 11622 S Terendale Ln
- 11622 Terendale Ln
- 11648 Carrington Ct
- 2197 E 11620 S
- 11651 Terendale Ln
Your Personal Tour Guide
Ask me questions while you tour the home.