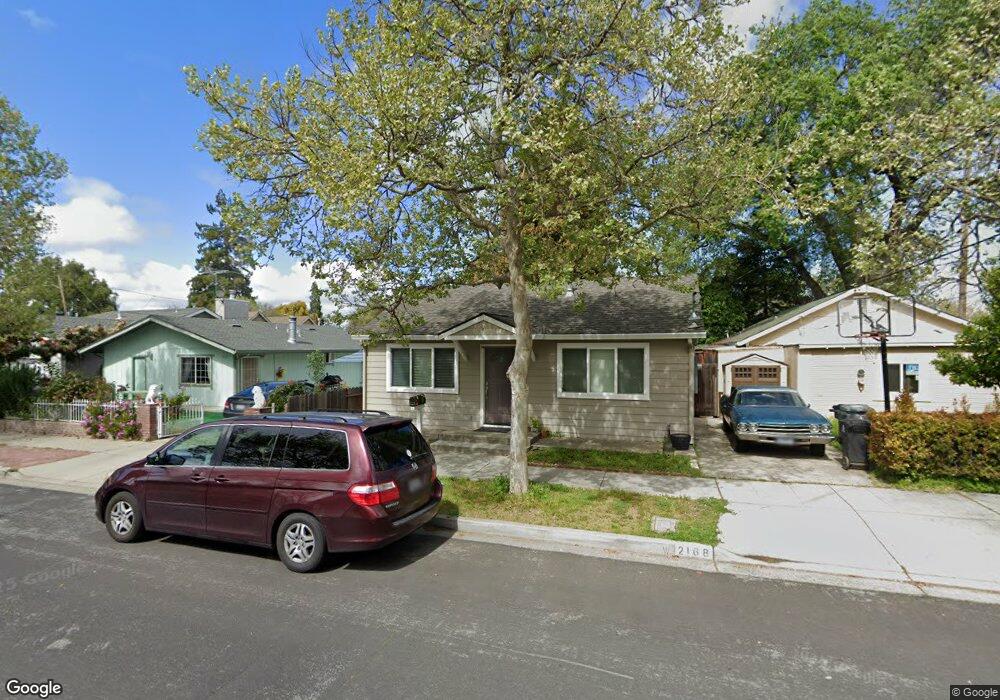
2168 Stanford Ave Mountain View, CA 94040
Mountain View West NeighborhoodEstimated Value: $1,252,516 - $3,676,000
2
Beds
1
Bath
864
Sq Ft
$2,360/Sq Ft
Est. Value
About This Home
This home is located at 2168 Stanford Ave, Mountain View, CA 94040 and is currently estimated at $2,038,629, approximately $2,359 per square foot. 2168 Stanford Ave is a home located in Santa Clara County with nearby schools including Monta Loma Elementary School, Isaac Newton Graham Middle School, and Los Altos High School.
Ownership History
Date
Name
Owned For
Owner Type
Purchase Details
Closed on
Oct 13, 2010
Sold by
Torres Reynaldo R
Bought by
Torres Reynaldo R and Torres Patricia
Current Estimated Value
Home Financials for this Owner
Home Financials are based on the most recent Mortgage that was taken out on this home.
Original Mortgage
$395,000
Outstanding Balance
$260,127
Interest Rate
4.31%
Mortgage Type
New Conventional
Estimated Equity
$1,778,502
Purchase Details
Closed on
Mar 16, 2009
Sold by
Torres Patricia
Bought by
Torres Reynaldo R
Home Financials for this Owner
Home Financials are based on the most recent Mortgage that was taken out on this home.
Original Mortgage
$400,000
Interest Rate
5.15%
Mortgage Type
New Conventional
Purchase Details
Closed on
Apr 15, 2005
Sold by
Torres Aurora R
Bought by
Torres Reynaldo R
Purchase Details
Closed on
Feb 15, 2005
Sold by
Torres Henry Peter
Bought by
Torres Aurora R
Create a Home Valuation Report for This Property
The Home Valuation Report is an in-depth analysis detailing your home's value as well as a comparison with similar homes in the area
Home Values in the Area
Average Home Value in this Area
Purchase History
| Date | Buyer | Sale Price | Title Company |
|---|---|---|---|
| Torres Reynaldo R | -- | North American Title Co Inc | |
| Torres Reynaldo R | -- | First American Title | |
| Torres Reynaldo R | -- | -- | |
| Torres Aurora R | -- | -- |
Source: Public Records
Mortgage History
| Date | Status | Borrower | Loan Amount |
|---|---|---|---|
| Open | Torres Reynaldo R | $395,000 | |
| Closed | Torres Reynaldo R | $400,000 |
Source: Public Records
Tax History Compared to Growth
Tax History
| Year | Tax Paid | Tax Assessment Tax Assessment Total Assessment is a certain percentage of the fair market value that is determined by local assessors to be the total taxable value of land and additions on the property. | Land | Improvement |
|---|---|---|---|---|
| 2025 | $975 | $64,622 | $25,382 | $39,240 |
| 2024 | $975 | $63,356 | $24,885 | $38,471 |
| 2023 | $965 | $62,115 | $24,398 | $37,717 |
| 2022 | $957 | $60,898 | $23,920 | $36,978 |
| 2021 | $936 | $59,704 | $23,451 | $36,253 |
| 2020 | $935 | $59,093 | $23,211 | $35,882 |
| 2019 | $906 | $57,935 | $22,756 | $35,179 |
| 2018 | $909 | $56,800 | $22,310 | $34,490 |
| 2017 | $881 | $55,687 | $21,873 | $33,814 |
| 2016 | $788 | $54,596 | $21,445 | $33,151 |
| 2015 | $769 | $53,777 | $21,123 | $32,654 |
| 2014 | $764 | $52,725 | $20,710 | $32,015 |
Source: Public Records
Map
Nearby Homes
- 2375 Adele Ave
- 49 Showers Dr Unit J317
- 49 Showers Dr Unit D460
- 49 Showers Dr Unit E151
- 49 Showers Dr Unit F438
- Plan 3BZ at Amelia
- Plan 7 at Amelia
- Plan 2 at Amelia
- Plan 3 at Amelia
- Plan 6B at Amelia
- Plan 3B at Amelia
- 576 S Rengstorff Ave
- Plan 6 at Amelia
- 1945 Mount Vernon Ct Unit 14
- 2483 Whitney Dr
- 347 N Rengstorff Ave
- 363 N Rengstorff Ave Unit 5
- 236 Higdon Ave
- 2255 Showers Dr Unit 111
- 938 Clark Ave Unit 47
- 186 Fair Oaks Ave
- 2176 Stanford Ave
- 174 Fair Oaks Ave
- 179175 Fair Oaks St
- 2159 Stanford Ave
- 2182 Stanford Ave
- 175 Fair Oaks Ave
- 179 Fair Oaks St
- 179 Fair Oaks Ave
- 162 Fair Oaks Ave
- 2175 Stanford Ave
- 214 Fair Oaks Ave
- 2188 Stanford Ave
- 2136 Stanford Ave
- 2185 Stanford Ave
- 169 College St
- 2145 Stanford Ave
- 169 Fair Oaks Ave
- 134 Fair Oaks Ave
- 169 College Ave