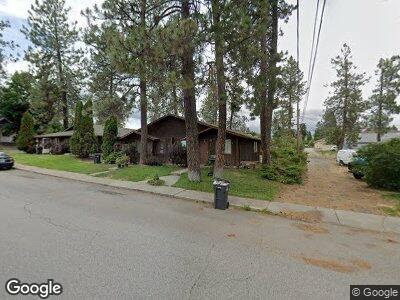
217 Ash St Cheney, WA 99004
Estimated Value: $303,000 - $377,000
4
Beds
2
Baths
1,480
Sq Ft
$226/Sq Ft
Est. Value
About This Home
This home is located at 217 Ash St, Cheney, WA 99004 and is currently estimated at $334,667, approximately $226 per square foot. 217 Ash St is a home located in Spokane County with nearby schools including Betz Elementary School, Cheney Middle School, and Cheney High School.
Ownership History
Date
Name
Owned For
Owner Type
Purchase Details
Closed on
Oct 8, 2019
Sold by
Estate Of Amy J Sooy
Bought by
Sooy Vickrey Linda
Current Estimated Value
Purchase Details
Closed on
Jul 26, 2006
Sold by
Sooy Ray M and Sooy Cathleen M
Bought by
Sooy Amy J
Home Financials for this Owner
Home Financials are based on the most recent Mortgage that was taken out on this home.
Original Mortgage
$50,000
Interest Rate
6.57%
Mortgage Type
Purchase Money Mortgage
Purchase Details
Closed on
Jan 31, 2002
Sold by
Sooy James F
Bought by
Sooy Ray M
Create a Home Valuation Report for This Property
The Home Valuation Report is an in-depth analysis detailing your home's value as well as a comparison with similar homes in the area
Home Values in the Area
Average Home Value in this Area
Purchase History
| Date | Buyer | Sale Price | Title Company |
|---|---|---|---|
| Sooy Vickrey Linda | -- | None Available | |
| Sooy Amy J | $140,000 | Spokane County Title Co | |
| Sooy Ray M | -- | -- |
Source: Public Records
Mortgage History
| Date | Status | Borrower | Loan Amount |
|---|---|---|---|
| Previous Owner | Sooy Amy J | $50,000 |
Source: Public Records
Tax History Compared to Growth
Tax History
| Year | Tax Paid | Tax Assessment Tax Assessment Total Assessment is a certain percentage of the fair market value that is determined by local assessors to be the total taxable value of land and additions on the property. | Land | Improvement |
|---|---|---|---|---|
| 2024 | $2,983 | $270,400 | $55,000 | $215,400 |
| 2023 | $2,291 | $255,900 | $75,000 | $180,900 |
| 2022 | $2,244 | $273,100 | $75,000 | $198,100 |
| 2021 | $2,103 | $183,600 | $31,500 | $152,100 |
| 2020 | $2,046 | $167,400 | $30,000 | $137,400 |
| 2019 | $1,815 | $156,300 | $28,000 | $128,300 |
| 2018 | $2,032 | $152,400 | $28,000 | $124,400 |
| 2017 | $1,757 | $145,500 | $28,000 | $117,500 |
| 2016 | $1,686 | $134,500 | $28,000 | $106,500 |
| 2015 | $1,627 | $132,000 | $28,000 | $104,000 |
| 2014 | -- | $132,000 | $28,000 | $104,000 |
| 2013 | -- | $0 | $0 | $0 |
Source: Public Records
Map
Nearby Homes