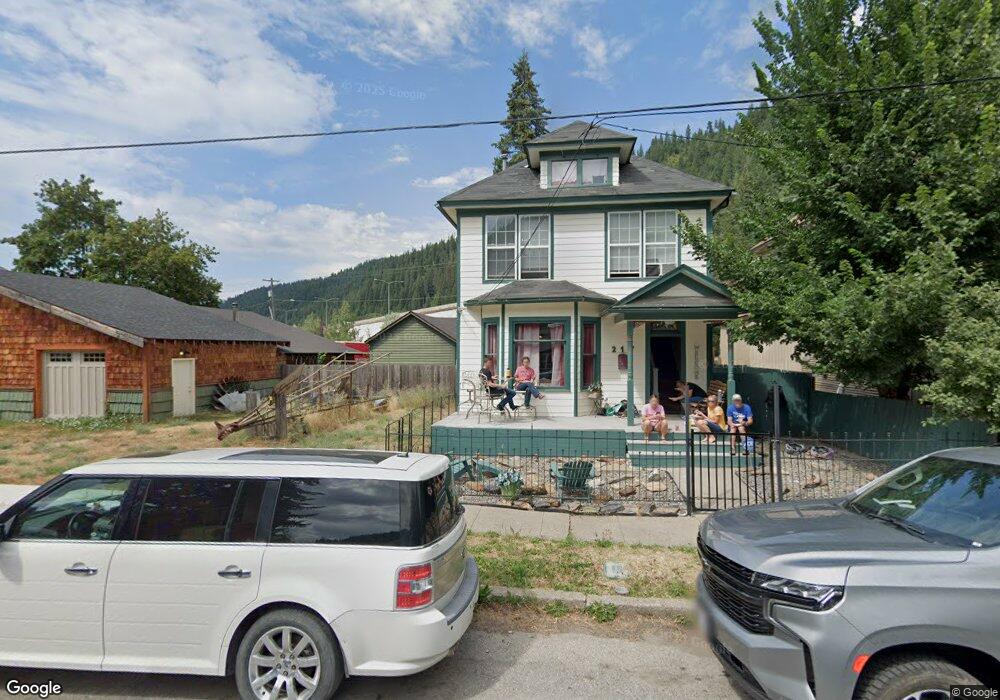
217 Cypress St Wallace, ID 83873
Estimated Value: $221,000 - $260,000
2
Beds
2
Baths
1,272
Sq Ft
$186/Sq Ft
Est. Value
About This Home
This home is located at 217 Cypress St, Wallace, ID 83873 and is currently estimated at $236,572, approximately $185 per square foot. 217 Cypress St is a home located in Shoshone County with nearby schools including Silver Hills Elementary School and Wallace Junior/Senior High School.
Ownership History
Date
Name
Owned For
Owner Type
Purchase Details
Closed on
Jan 9, 2018
Sold by
Riordan Debra and Kwake Stanley Joseph
Bought by
Mcmaster Peter and Olsen Melba Cherlyn
Current Estimated Value
Home Financials for this Owner
Home Financials are based on the most recent Mortgage that was taken out on this home.
Original Mortgage
$72,250
Outstanding Balance
$60,908
Interest Rate
3.9%
Estimated Equity
$175,664
Purchase Details
Closed on
Oct 2, 2013
Sold by
Federal National Mortgage Association
Bought by
Dro Ip Ltd
Create a Home Valuation Report for This Property
The Home Valuation Report is an in-depth analysis detailing your home's value as well as a comparison with similar homes in the area
Home Values in the Area
Average Home Value in this Area
Purchase History
| Date | Buyer | Sale Price | Title Company |
|---|---|---|---|
| Mcmaster Peter | -- | First American Title Co | |
| Dro Ip Ltd | $13,850 | Servicelink |
Source: Public Records
Mortgage History
| Date | Status | Borrower | Loan Amount |
|---|---|---|---|
| Open | Mcmaster Peter | $72,250 |
Source: Public Records
Tax History Compared to Growth
Tax History
| Year | Tax Paid | Tax Assessment Tax Assessment Total Assessment is a certain percentage of the fair market value that is determined by local assessors to be the total taxable value of land and additions on the property. | Land | Improvement |
|---|---|---|---|---|
| 2025 | $1,978 | $198,422 | $19,360 | $179,062 |
| 2024 | $1,978 | $198,422 | $19,360 | $179,062 |
| 2023 | $1,978 | $201,412 | $19,360 | $182,052 |
| 2022 | $2,037 | $149,513 | $9,230 | $140,283 |
| 2021 | $2,318 | $114,655 | $7,965 | $106,690 |
| 2020 | $1,980 | $91,186 | $7,576 | $83,610 |
| 2019 | $1,965 | $92,241 | $7,057 | $85,184 |
| 2018 | $1,749 | $69,292 | $6,416 | $62,876 |
| 2017 | $1,627 | $63,319 | $6,416 | $56,903 |
| 2016 | $1,537 | $56,456 | $6,416 | $50,040 |
| 2015 | -- | $56,456 | $6,416 | $50,040 |
| 2014 | -- | $43,975 | $6,415 | $37,560 |
Source: Public Records
Map
Nearby Homes