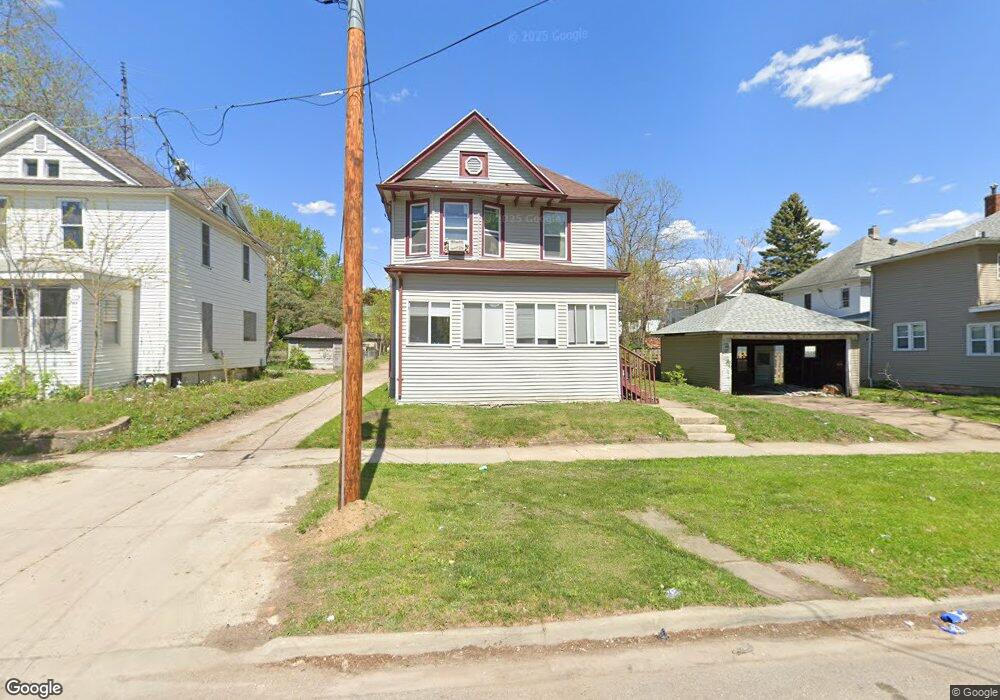
217 Locust St Waterloo, IA 50701
Church Row NeighborhoodEstimated Value: $62,000 - $95,000
3
Beds
1
Bath
1,200
Sq Ft
$62/Sq Ft
Est. Value
About This Home
This home is located at 217 Locust St, Waterloo, IA 50701 and is currently estimated at $74,589, approximately $62 per square foot. 217 Locust St is a home located in Black Hawk County with nearby schools including Irving Elementary School, Central Middle School, and West High School.
Ownership History
Date
Name
Owned For
Owner Type
Purchase Details
Closed on
Dec 29, 2017
Sold by
Tej & Tjj Llc
Bought by
Rock Star Real Estate Llc
Current Estimated Value
Purchase Details
Closed on
Nov 21, 2014
Sold by
Tl Properties Ia 2011 Llc
Bought by
Tej And Tjj Llc
Create a Home Valuation Report for This Property
The Home Valuation Report is an in-depth analysis detailing your home's value as well as a comparison with similar homes in the area
Home Values in the Area
Average Home Value in this Area
Purchase History
| Date | Buyer | Sale Price | Title Company |
|---|---|---|---|
| Rock Star Real Estate Llc | -- | None Available | |
| Tej And Tjj Llc | $16,500 | None Available |
Source: Public Records
Tax History Compared to Growth
Tax History
| Year | Tax Paid | Tax Assessment Tax Assessment Total Assessment is a certain percentage of the fair market value that is determined by local assessors to be the total taxable value of land and additions on the property. | Land | Improvement |
|---|---|---|---|---|
| 2025 | $948 | $50,700 | $3,720 | $46,980 |
| 2024 | $948 | $43,740 | $3,720 | $40,020 |
| 2023 | $788 | $43,740 | $3,720 | $40,020 |
| 2022 | $838 | $35,900 | $3,720 | $32,180 |
| 2021 | $964 | $35,900 | $3,720 | $32,180 |
| 2020 | $950 | $39,480 | $3,720 | $35,760 |
| 2019 | $873 | $39,480 | $3,720 | $35,760 |
| 2018 | $873 | $39,480 | $3,720 | $35,760 |
| 2017 | $897 | $35,810 | $3,720 | $32,090 |
| 2016 | $488 | $35,810 | $3,720 | $32,090 |
| 2015 | $488 | $21,490 | $3,720 | $17,770 |
| 2014 | $644 | $27,860 | $3,720 | $24,140 |
Source: Public Records
Map
Nearby Homes
- 319 Locust St
- 928 W 2nd St
- 407 Locust St
- 258 Western Ave
- 114 Allen St
- 918 W 4th St
- 307 Baltimore St
- 821 W Mullan Ave
- 264 Baltimore St
- 211 Fereday Ct
- 206 Randolph St
- 430 Oaklawn Ave
- 1116 W Mullan Ave
- 209 Randall St
- 1223 W Mullan Ave
- 915 W 5th St
- 1225 W Mullan Ave
- 1227 W Mullan Ave
- 403 Belmont Ave
- 1229 W Mullan Ave