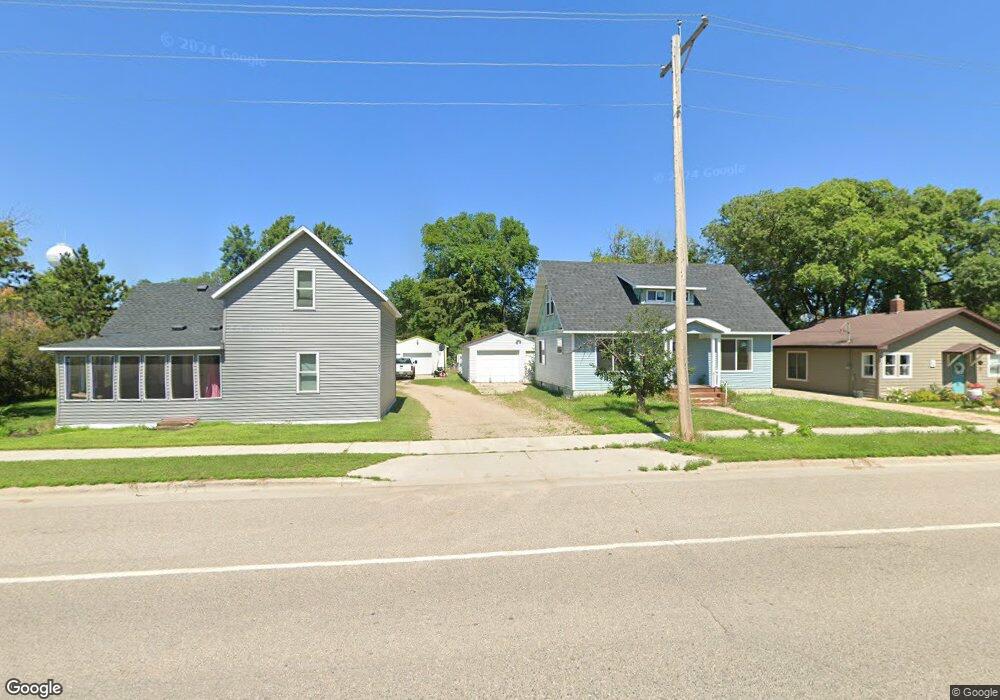
217 Main St NW Menahga, MN 56464
Estimated Value: $115,000 - $172,000
2
Beds
1
Bath
960
Sq Ft
$143/Sq Ft
Est. Value
About This Home
This home is located at 217 Main St NW, Menahga, MN 56464 and is currently estimated at $137,059, approximately $142 per square foot. 217 Main St NW is a home located in Wadena County with nearby schools including Menahga Elementary School and Menahga High School.
Ownership History
Date
Name
Owned For
Owner Type
Purchase Details
Closed on
Aug 23, 2021
Sold by
Marhjamaa Wade and Marhjamaa Linda
Bought by
Etter Sharon A
Current Estimated Value
Home Financials for this Owner
Home Financials are based on the most recent Mortgage that was taken out on this home.
Original Mortgage
$82,212
Outstanding Balance
$74,756
Interest Rate
2.9%
Mortgage Type
New Conventional
Estimated Equity
$62,303
Purchase Details
Closed on
Oct 21, 2008
Sold by
Deutsche Bank National Trust Company
Bought by
Marjamaa Wade and Marjamaa Linda
Home Financials for this Owner
Home Financials are based on the most recent Mortgage that was taken out on this home.
Original Mortgage
$19,000
Interest Rate
8%
Mortgage Type
Future Advance Clause Open End Mortgage
Purchase Details
Closed on
Aug 2, 2005
Sold by
Thompson Adele J
Bought by
Marjama Shawn A
Home Financials for this Owner
Home Financials are based on the most recent Mortgage that was taken out on this home.
Original Mortgage
$48,000
Interest Rate
8.7%
Mortgage Type
Adjustable Rate Mortgage/ARM
Create a Home Valuation Report for This Property
The Home Valuation Report is an in-depth analysis detailing your home's value as well as a comparison with similar homes in the area
Home Values in the Area
Average Home Value in this Area
Purchase History
| Date | Buyer | Sale Price | Title Company |
|---|---|---|---|
| Etter Sharon A | $81,391 | Leer Title | |
| Marjamaa Wade | -- | None Available | |
| Marjama Shawn A | $63,500 | None Available |
Source: Public Records
Mortgage History
| Date | Status | Borrower | Loan Amount |
|---|---|---|---|
| Open | Etter Sharon A | $82,212 | |
| Previous Owner | Marjamaa Wade | $19,000 | |
| Previous Owner | Marjama Shawn A | $48,000 |
Source: Public Records
Tax History Compared to Growth
Tax History
| Year | Tax Paid | Tax Assessment Tax Assessment Total Assessment is a certain percentage of the fair market value that is determined by local assessors to be the total taxable value of land and additions on the property. | Land | Improvement |
|---|---|---|---|---|
| 2025 | $814 | $102,500 | $9,700 | $92,800 |
| 2024 | $814 | $88,400 | $7,800 | $80,600 |
| 2023 | $688 | $90,800 | $5,800 | $85,000 |
| 2022 | $524 | $66,100 | $5,800 | $60,300 |
| 2021 | $792 | $38,200 | $4,100 | $34,100 |
| 2020 | $786 | $38,100 | $4,100 | $34,000 |
| 2019 | $778 | $36,900 | $4,100 | $32,800 |
| 2018 | $746 | $36,600 | $4,100 | $32,500 |
| 2017 | $74 | $32,300 | $4,100 | $28,200 |
| 2016 | $736 | $31,654 | $4,018 | $27,636 |
| 2015 | $730 | $0 | $0 | $0 |
| 2014 | -- | $0 | $0 | $0 |
Source: Public Records
Map
Nearby Homes
- 232 2nd St NW
- 222 Dogwood Ave NW
- 29 Fir Ave NW
- 44 Hickory Ave NW
- 18 Cedar Ave SE
- 219 Main St NE
- 20 Elm Ave NE
- 317 2nd St NE
- 715 4th Ln NW
- 851 E Blueberry River Dr
- 740 1st St NE
- 37237 Pine Cone Dr
- 37095 Twin Lakes Rd
- 37263 Pine Cone Dr
- 37160 W Stocking Dr
- 38564 E Blueberry Dr
- 12435 340th St
- 10244 Minnesota 87
- 12343 Blueberry Loop
- 12245 Blueberry Loop
- 215 Main St NW
- 215 215 Main-Street-nw
- 221 Main St NW
- 223 Main St NW
- 218 1st St NW
- 216 1st St NW
- 213 Main St W
- 227 Main St NW
- 1.34 AC Main St W
- 222 1st St NW
- 218 Main St SW
- 212 Main St SW
- 226 1st St NW
- 127 Main St NW
- 229 Main St NW
- 224 Main St SW
- 226 Main St SW Unit B
- 212 1st St NW
- 226b Main St SW
- 125 Main St NW