217 March Rd Sanbornton, NH 03269
Sanbornton NeighborhoodEstimated Value: $410,000 - $598,000
2
Beds
2
Baths
1,439
Sq Ft
$329/Sq Ft
Est. Value
About This Home
This home is located at 217 March Rd, Sanbornton, NH 03269 and is currently estimated at $473,895, approximately $329 per square foot. 217 March Rd is a home located in Belknap County with nearby schools including Southwick School, Winnisquam Regional Middle School, and Winnisquam Regional High School.
Ownership History
Date
Name
Owned For
Owner Type
Purchase Details
Closed on
Oct 10, 2023
Sold by
Livington One Ft and Livingstone
Bought by
Livingstone Alexander
Current Estimated Value
Purchase Details
Closed on
Jan 17, 2012
Sold by
Livingstone 1 Ft and Livingstone
Bought by
Livingstone 4Th Alexander and Livingstone Sheila B
Home Financials for this Owner
Home Financials are based on the most recent Mortgage that was taken out on this home.
Original Mortgage
$110,025
Interest Rate
4%
Mortgage Type
New Conventional
Create a Home Valuation Report for This Property
The Home Valuation Report is an in-depth analysis detailing your home's value as well as a comparison with similar homes in the area
Home Values in the Area
Average Home Value in this Area
Purchase History
| Date | Buyer | Sale Price | Title Company |
|---|---|---|---|
| Livingstone Alexander | -- | None Available | |
| Livingstone 4Th Alexander | -- | -- | |
| Livingstone One Ft | -- | -- |
Source: Public Records
Mortgage History
| Date | Status | Borrower | Loan Amount |
|---|---|---|---|
| Previous Owner | Livingstone 4Th Alexander | $110,025 |
Source: Public Records
Tax History Compared to Growth
Tax History
| Year | Tax Paid | Tax Assessment Tax Assessment Total Assessment is a certain percentage of the fair market value that is determined by local assessors to be the total taxable value of land and additions on the property. | Land | Improvement |
|---|---|---|---|---|
| 2024 | $4,148 | $323,800 | $146,200 | $177,600 |
| 2023 | $3,899 | $323,800 | $146,200 | $177,600 |
| 2022 | $4,210 | $211,900 | $102,200 | $109,700 |
| 2021 | $3,889 | $211,600 | $102,200 | $109,400 |
| 2020 | $4,270 | $211,600 | $102,200 | $109,400 |
| 2019 | $4,067 | $211,600 | $102,200 | $109,400 |
| 2018 | $4,088 | $211,600 | $102,200 | $109,400 |
| 2017 | $3,871 | $163,800 | $70,100 | $93,700 |
| 2016 | $3,871 | $163,800 | $70,100 | $93,700 |
| 2015 | $3,933 | $163,800 | $70,100 | $93,700 |
| 2014 | $3,762 | $163,800 | $70,100 | $93,700 |
| 2013 | $3,762 | $163,800 | $70,100 | $93,700 |
Source: Public Records
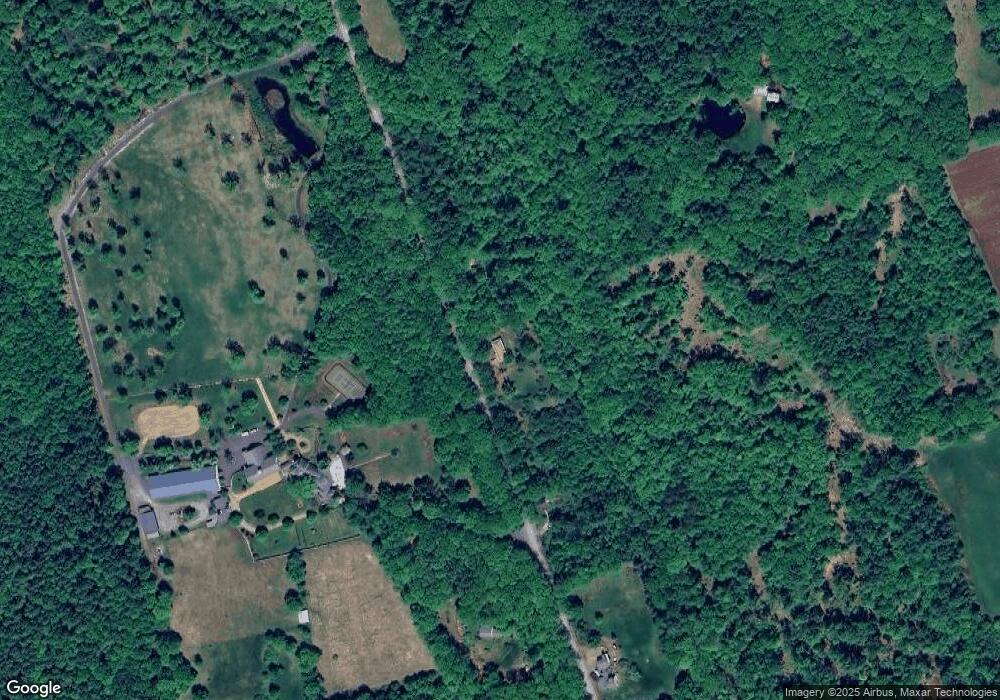
Map
Nearby Homes
- 0 Gulf Rd Unit 33 5061892
- 724 Sanborn Rd
- 0 Perley Hill Rd Unit 85
- R02-13 Calef Hill Rd
- 9 Aspen Rd
- 1 Marsh Hill Cir
- 12 Foothills Way
- 0 Clark Rd Unit 7-1 5058307
- 7 Simmons Ct
- 225 Kendall St
- 104 New Hampton Rd
- 18 Pine St
- 42 Woodrow Ave
- 193 Kendall St
- 21 Mountain View Dr
- 9 Hunt Ave
- 9 High St
- 180 Kendall St
- 22 Cedar St
- 495 W Main St
- 199 March Rd
- 184 March Rd
- 181 March Rd
- 200 March Rd
- 156 Calef Hill Rd
- 149 March Rd
- 416 Calef Hill Rd
- 131 March Rd
- 00 Calef Hill Rd
- 0 Calef Hill Rd Unit 5054184
- 0 Calef Hill Rd Unit 4163076
- 0 Calef Hill Rd Unit 4163082
- 0 Calef Hill Rd Unit 2797095
- 0 Calef Hill Rd Unit 2776110
- 0 Calef Hill Rd Unit 2797093
- 0 Calef Hill Rd Unit 2776120
- 402 Calef Hill Rd
- 91 March Rd
- 404 Calef Hill Rd
- 126 Calef Hill Rd