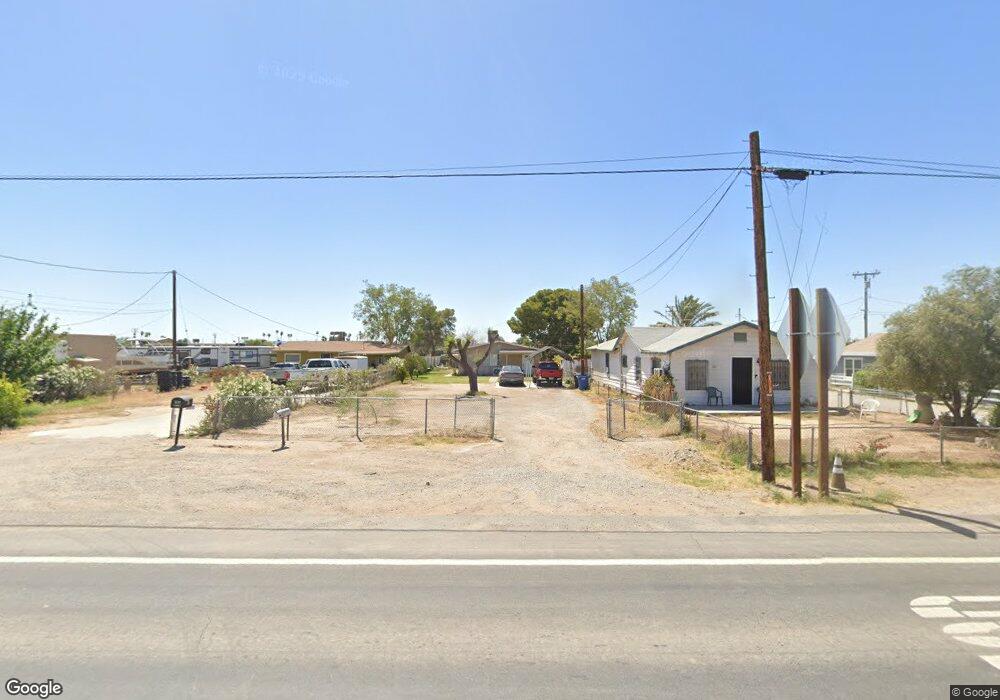
217 N Intake Blvd Blythe, CA 92225
Estimated Value: $74,000 - $166,423
3
Beds
1
Bath
1,040
Sq Ft
$130/Sq Ft
Est. Value
About This Home
This home is located at 217 N Intake Blvd, Blythe, CA 92225 and is currently estimated at $135,141, approximately $129 per square foot. 217 N Intake Blvd is a home located in Riverside County with nearby schools including Palo Verde High School and Scale Leadership Academy - East.
Ownership History
Date
Name
Owned For
Owner Type
Purchase Details
Closed on
Jan 11, 2002
Sold by
Sullivan Investments
Bought by
Mejia Santos F
Current Estimated Value
Home Financials for this Owner
Home Financials are based on the most recent Mortgage that was taken out on this home.
Original Mortgage
$61,407
Outstanding Balance
$24,259
Interest Rate
7.17%
Mortgage Type
FHA
Estimated Equity
$110,882
Purchase Details
Closed on
Aug 10, 2001
Sold by
Hud
Bought by
Sullivan Investments
Purchase Details
Closed on
Oct 31, 2000
Sold by
Countrywide Home Loans
Bought by
Hud
Purchase Details
Closed on
Oct 27, 2000
Sold by
Ferrone Emilio
Bought by
Countrywide Home Loans Inc
Purchase Details
Closed on
Apr 1, 1996
Sold by
Means Robert L and Means Mary L
Bought by
Ferrone Emilio
Home Financials for this Owner
Home Financials are based on the most recent Mortgage that was taken out on this home.
Original Mortgage
$51,973
Interest Rate
7.41%
Mortgage Type
FHA
Purchase Details
Closed on
Mar 7, 1996
Sold by
Mcwilliams Michael
Bought by
Means Robert L and Means Mary L
Home Financials for this Owner
Home Financials are based on the most recent Mortgage that was taken out on this home.
Original Mortgage
$51,973
Interest Rate
7.41%
Mortgage Type
FHA
Create a Home Valuation Report for This Property
The Home Valuation Report is an in-depth analysis detailing your home's value as well as a comparison with similar homes in the area
Home Values in the Area
Average Home Value in this Area
Purchase History
| Date | Buyer | Sale Price | Title Company |
|---|---|---|---|
| Mejia Santos F | $62,000 | First American Title Co | |
| Sullivan Investments | $16,000 | First American Title Co | |
| Hud | -- | Landsafe Title | |
| Countrywide Home Loans Inc | $54,739 | Landsafe Title | |
| Ferrone Emilio | $52,000 | Commonwealth Land Title Co | |
| Means Robert L | $40,000 | Commonwealth Land Title Co |
Source: Public Records
Mortgage History
| Date | Status | Borrower | Loan Amount |
|---|---|---|---|
| Open | Mejia Santos F | $61,407 | |
| Previous Owner | Ferrone Emilio | $51,973 | |
| Previous Owner | Means Robert L | $40,000 |
Source: Public Records
Tax History
| Year | Tax Paid | Tax Assessment Tax Assessment Total Assessment is a certain percentage of the fair market value that is determined by local assessors to be the total taxable value of land and additions on the property. | Land | Improvement |
|---|---|---|---|---|
| 2025 | $995 | $91,558 | $36,916 | $54,642 |
| 2023 | $995 | $88,005 | $35,484 | $52,521 |
| 2022 | $955 | $86,281 | $34,789 | $51,492 |
| 2021 | $930 | $84,590 | $34,107 | $50,483 |
| 2020 | $920 | $83,724 | $33,758 | $49,966 |
| 2019 | $912 | $82,084 | $33,097 | $48,987 |
| 2018 | $853 | $80,476 | $32,449 | $48,027 |
| 2017 | $835 | $78,899 | $31,813 | $47,086 |
| 2016 | $827 | $77,353 | $31,190 | $46,163 |
| 2015 | $819 | $76,192 | $30,722 | $45,470 |
| 2014 | $787 | $74,701 | $30,121 | $44,580 |
Source: Public Records
Map
Nearby Homes
- 1834 E Chanslor Way
- 5.7 Acres E Hobsonway
- 1581 E Hobsonway
- 1354 E Hobsonway
- 1.18 Acres E Donlon St
- 321 Alameda St
- 0.93 Acres E Donlon St
- 1.22 Acres E Donlon St
- 1.08 Acres E Donlon St
- 1.12 Acres E Donlon St
- 1.17 Acres E Donlon St
- 1.01 Acres E Donlon St
- 1.10 Acres E Donlon St
- 1367 E Hobsonway
- 470 El Dorado
- 0 El Dorado
- 2265 E Chanslor Way
- 421 Tesoro Ln
- 168 Acacia Ave
- 396 N Earle St
- 207 N Intake Blvd
- 221 N Intake Blvd
- 12693 N Intake Blvd
- 263 N Intake Blvd
- 213 Ward St
- 231 Ward St
- 254 N Intake Blvd
- 271 N Intake Blvd
- 271 N Intake Blvd
- 251 Ward St
- 246 N Intake Blvd
- 261 Ward St
- 12624 N Intake Blvd
- 0 Agate Terrace Rd
- 0 Agate Terrace
- 0000 Intake Blvd
- 292 N Intake Blvd
- 1950 Agate Terrace
- 8950 Agate Terrace
- 1853 E Hobsonway
Your Personal Tour Guide
Ask me questions while you tour the home.