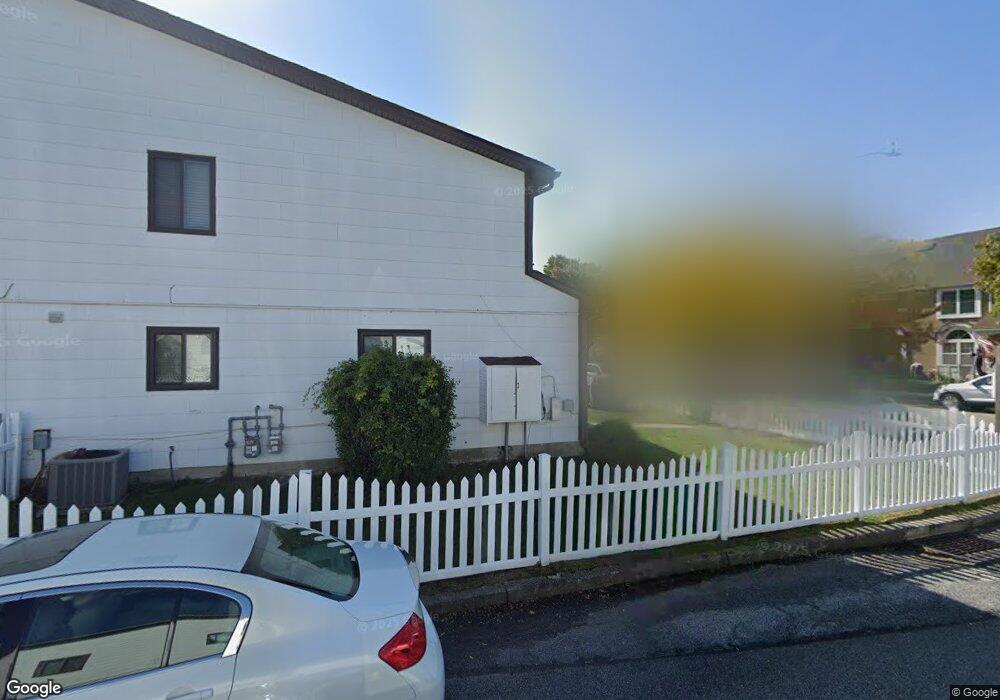
217 Parkview Loop Unit 141 Staten Island, NY 10314
Willowbrook NeighborhoodEstimated Value: $502,000 - $515,000
3
Beds
2
Baths
1,142
Sq Ft
$446/Sq Ft
Est. Value
About This Home
This home is located at 217 Parkview Loop Unit 141, Staten Island, NY 10314 and is currently estimated at $509,333, approximately $446 per square foot. 217 Parkview Loop Unit 141 is a home located in Richmond County with nearby schools including P.S. 060 Alice Austen School, Is 72 Rocco Laurie, and Port Richmond High School.
Ownership History
Date
Name
Owned For
Owner Type
Purchase Details
Closed on
Oct 25, 2024
Sold by
Postelnek Brianna
Bought by
Postelnek Paul
Current Estimated Value
Purchase Details
Closed on
Sep 23, 2024
Sold by
Postelnek Howard B and Postelnek Paul
Bought by
Postelnek Paul and Postelnek Brianna
Purchase Details
Closed on
Aug 12, 2002
Sold by
Leftow Sherry and Postelnek Howard B
Bought by
Leftow Sherry and Postelnek Howard B
Purchase Details
Closed on
Jan 6, 1999
Sold by
Postelnek Howard and Postelnek Rosalie
Bought by
Postelnek Howard
Home Financials for this Owner
Home Financials are based on the most recent Mortgage that was taken out on this home.
Original Mortgage
$86,000
Interest Rate
6.76%
Create a Home Valuation Report for This Property
The Home Valuation Report is an in-depth analysis detailing your home's value as well as a comparison with similar homes in the area
Home Values in the Area
Average Home Value in this Area
Purchase History
| Date | Buyer | Sale Price | Title Company |
|---|---|---|---|
| Postelnek Paul | $80,000 | None Listed On Document | |
| Postelnek Paul | $80,000 | None Listed On Document | |
| Postelnek Paul | -- | None Listed On Document | |
| Postelnek Paul | -- | None Listed On Document | |
| Leftow Sherry | -- | -- | |
| Postelnek Howard | $45,000 | Ticor Title Guarantee Compan |
Source: Public Records
Mortgage History
| Date | Status | Borrower | Loan Amount |
|---|---|---|---|
| Previous Owner | Postelnek Howard | $86,000 |
Source: Public Records
Tax History Compared to Growth
Tax History
| Year | Tax Paid | Tax Assessment Tax Assessment Total Assessment is a certain percentage of the fair market value that is determined by local assessors to be the total taxable value of land and additions on the property. | Land | Improvement |
|---|---|---|---|---|
| 2025 | $3,744 | $28,062 | $1,822 | $26,240 |
| 2024 | $3,756 | $23,734 | $2,137 | $21,597 |
| 2023 | $3,555 | $18,907 | $2,008 | $16,899 |
| 2022 | $3,274 | $21,234 | $2,531 | $18,703 |
| 2021 | $3,239 | $19,334 | $2,531 | $16,803 |
| 2020 | $3,266 | $19,201 | $2,531 | $16,670 |
| 2019 | $3,201 | $18,052 | $2,531 | $15,521 |
| 2018 | $2,914 | $15,756 | $2,252 | $13,504 |
| 2017 | $2,731 | $14,865 | $2,304 | $12,561 |
| 2016 | $2,494 | $14,025 | $2,217 | $11,808 |
| 2015 | $2,366 | $14,025 | $2,082 | $11,943 |
| 2014 | $2,366 | $13,918 | $2,455 | $11,463 |
Source: Public Records
Map
Nearby Homes
- 15 Parkview Loop
- 17 Parkview Loop
- 132 Parkview Loop Unit 85
- 56 Gary Ct
- 12 Leggett Place
- 40 Lander Ave
- 24 Globe Ave
- 71 Goller Place
- 333 Hillman Ave
- 281 Arlene St
- 45 Sommer Ave
- 87 Saybrook St
- 317 Hillman Ave
- 94 Saybrook St
- 76 Croft Place
- 140 Lander Ave
- 131 Lander Ave
- 1775 Richmond Ave
- 469 Willow Rd E Unit 1
- 74 Sumner Ave
- 215 Parkview Loop
- 215 Debbie St
- 201 Parkview Loop
- 203 Parkview Loop Unit 213
- 203 Parkview Loop
- 211 Parkview Loop
- 205 Parkview Loop
- 209 Parkview Loop Unit 136
- 207 Parkview Loop
- 75 Debbie St Unit 144
- 83 Debbie St Unit 143
- 77 Debbie St
- 85 Debbie St
- 79 Debbie St Unit 148
- 87 Debbie St
- 119 Morani St Unit 57
- 113 Morani St
- 191 Parkview Loop
- 107 Morani St Unit 63
- 121 Morani St Unit 58