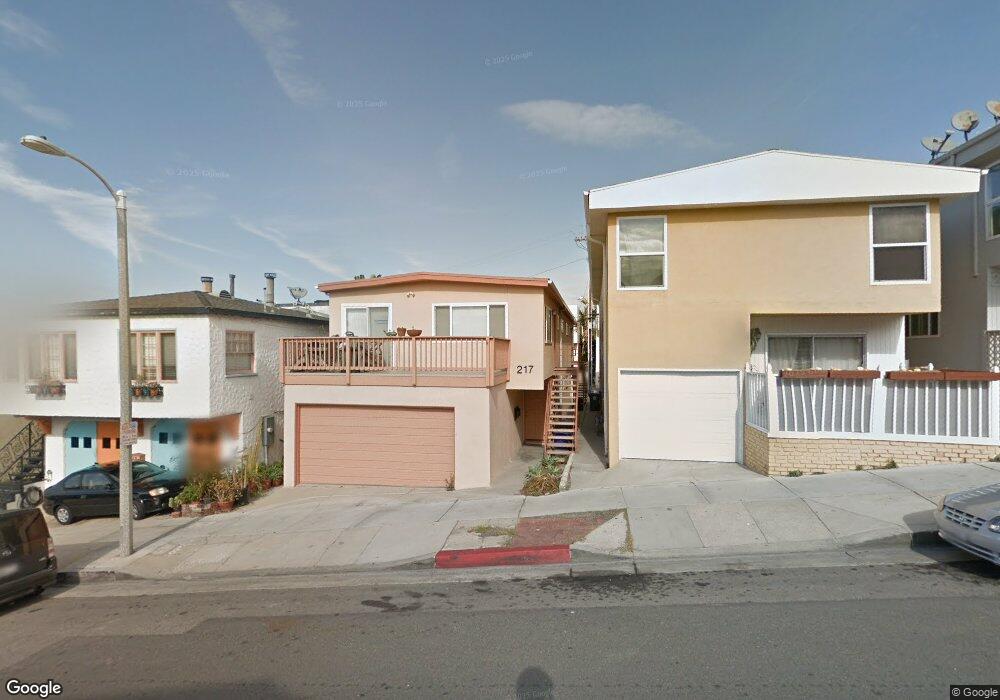
217 Rosecrans Ave Manhattan Beach, CA 90266
Estimated Value: $3,351,000 - $3,893,000
6
Beds
3
Baths
2,640
Sq Ft
$1,372/Sq Ft
Est. Value
About This Home
This home is located at 217 Rosecrans Ave, Manhattan Beach, CA 90266 and is currently estimated at $3,622,000, approximately $1,371 per square foot. 217 Rosecrans Ave is a home located in Los Angeles County with nearby schools including Grand View Elementary School, Manhattan Beach Middle School, and Mira Costa High School.
Ownership History
Date
Name
Owned For
Owner Type
Purchase Details
Closed on
Sep 12, 2005
Sold by
Lowry Charles J
Bought by
Lowry Charles J and Lowry Trust
Current Estimated Value
Purchase Details
Closed on
Sep 9, 2005
Sold by
Lowry Kirk G
Bought by
Lowry Kirk G and Lowry Trust
Purchase Details
Closed on
Jul 7, 2004
Sold by
Lowry James A and Treman Sara
Bought by
Lowry James A and Treman Sara
Purchase Details
Closed on
Mar 15, 2004
Sold by
Lowry James A and Lowry Trust
Bought by
Lowry James A and Lowry Charles J
Purchase Details
Closed on
Aug 3, 2000
Sold by
Lowry Catherine and Lowry Trust
Bought by
Lowry James A and Lowry Charles J
Purchase Details
Closed on
Dec 27, 1999
Sold by
Trust Lowry S And Catherine Trs Lo
Bought by
Lowry James A and Lowry Sara Bowman
Purchase Details
Closed on
Dec 19, 1997
Sold by
Trust Lowry S J And Catherine Trs Lowry
Bought by
Lowry James A and Lowry Sara Bowman
Create a Home Valuation Report for This Property
The Home Valuation Report is an in-depth analysis detailing your home's value as well as a comparison with similar homes in the area
Home Values in the Area
Average Home Value in this Area
Purchase History
| Date | Buyer | Sale Price | Title Company |
|---|---|---|---|
| Lowry Charles J | -- | -- | |
| Lowry Kirk G | -- | -- | |
| Lowry James A | -- | -- | |
| Lowry James A | -- | -- | |
| Lowry James A | -- | -- | |
| Lowry James A | -- | -- | |
| Lowry James A | -- | -- | |
| Lowry S J | -- | -- |
Source: Public Records
Tax History
| Year | Tax Paid | Tax Assessment Tax Assessment Total Assessment is a certain percentage of the fair market value that is determined by local assessors to be the total taxable value of land and additions on the property. | Land | Improvement |
|---|---|---|---|---|
| 2025 | $3,508 | $244,377 | $158,109 | $86,268 |
| 2024 | $3,508 | $239,586 | $155,009 | $84,577 |
| 2023 | $3,339 | $234,889 | $151,970 | $82,919 |
| 2022 | $3,292 | $230,285 | $148,991 | $81,294 |
| 2021 | $3,346 | $225,770 | $146,070 | $79,700 |
| 2019 | $3,270 | $219,076 | $141,739 | $77,337 |
| 2018 | $3,164 | $214,781 | $138,960 | $75,821 |
| 2016 | $2,748 | $206,443 | $133,565 | $72,878 |
| 2015 | $2,697 | $203,343 | $131,559 | $71,784 |
| 2014 | $2,684 | $199,360 | $128,982 | $70,378 |
Source: Public Records
Map
Nearby Homes
- 221 Rosecrans Ave
- 221 Rosecrans Ave Unit 3
- 221 Rosecrans Ave Unit 2
- 221 Rosecrans Ave Unit 1
- 221 Rosecrans Ave
- 212 Rosecrans Place
- 225 Rosecrans Ave Unit 3
- 225 Rosecrans Ave Unit 2
- 225 Rosecrans Ave Unit 1
- 225 Rosecrans Ave
- 217 Rosecrans Place
- 204 Rosecrans Place
- 205 Rosecrans Ave
- 213 Rosecrans Place Unit A
- 213 Rosecrans Place
- 213 Rosecrans Ave
- 209 Rosecrans Ave Unit C
- 209 Rosecrans Ave Unit B
- 209 Rosecrans Ave Unit A
- 209 Rosecrans Ave
Your Personal Tour Guide
Ask me questions while you tour the home.