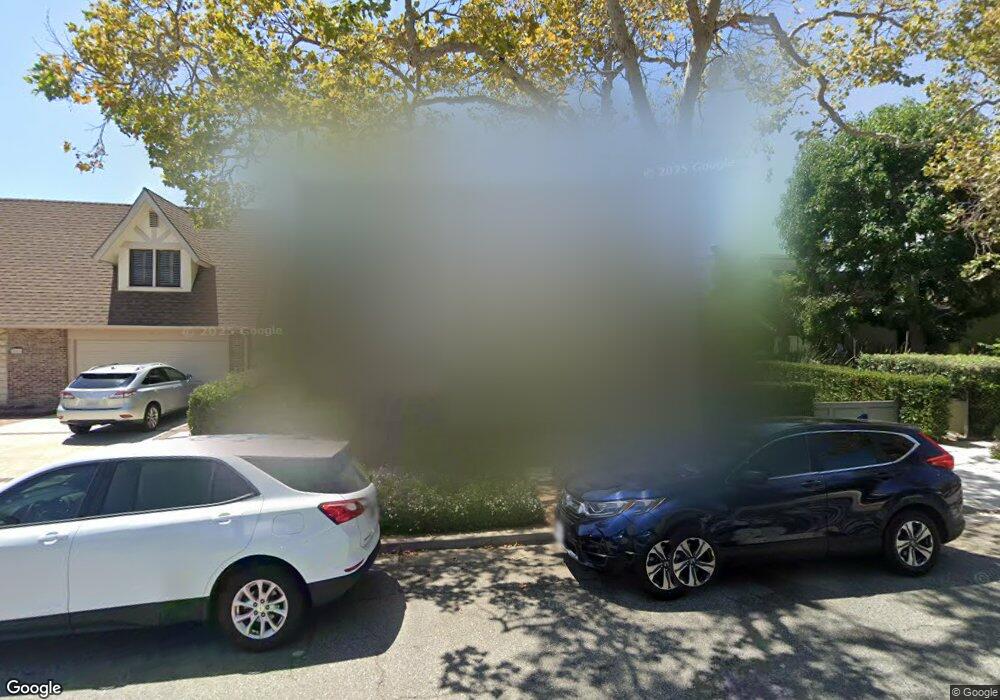
217 S Linden Dr Beverly Hills, CA 90212
Estimated Value: $4,152,000 - $5,608,083
5
Beds
5
Baths
4,176
Sq Ft
$1,201/Sq Ft
Est. Value
About This Home
This home is located at 217 S Linden Dr, Beverly Hills, CA 90212 and is currently estimated at $5,014,271, approximately $1,200 per square foot. 217 S Linden Dr is a home located in Los Angeles County with nearby schools including El Rodeo Elementary School, Beverly Hills High School, and Good Shepherd Catholic School.
Ownership History
Date
Name
Owned For
Owner Type
Purchase Details
Closed on
Mar 23, 2009
Sold by
Iclisoy Arthur
Bought by
Iclisoy Arthur and Iclisoy Jessica
Current Estimated Value
Purchase Details
Closed on
Mar 3, 1997
Sold by
Pollock Arthur J
Bought by
Iclisoy Arthur and Iclisoy Jessica
Home Financials for this Owner
Home Financials are based on the most recent Mortgage that was taken out on this home.
Original Mortgage
$472,000
Outstanding Balance
$58,562
Interest Rate
8%
Estimated Equity
$4,955,709
Purchase Details
Closed on
Aug 19, 1996
Sold by
Pollock Arthur J
Bought by
Pollock Arthur J and Zavidow Sondra
Home Financials for this Owner
Home Financials are based on the most recent Mortgage that was taken out on this home.
Original Mortgage
$82,500
Interest Rate
4.25%
Create a Home Valuation Report for This Property
The Home Valuation Report is an in-depth analysis detailing your home's value as well as a comparison with similar homes in the area
Home Values in the Area
Average Home Value in this Area
Purchase History
| Date | Buyer | Sale Price | Title Company |
|---|---|---|---|
| Iclisoy Arthur | -- | None Available | |
| Iclisoy Arthur | $590,000 | Equity Title Company | |
| Pollock Arthur J | -- | First American |
Source: Public Records
Mortgage History
| Date | Status | Borrower | Loan Amount |
|---|---|---|---|
| Open | Iclisoy Arthur | $472,000 | |
| Previous Owner | Pollock Arthur J | $82,500 |
Source: Public Records
Tax History Compared to Growth
Tax History
| Year | Tax Paid | Tax Assessment Tax Assessment Total Assessment is a certain percentage of the fair market value that is determined by local assessors to be the total taxable value of land and additions on the property. | Land | Improvement |
|---|---|---|---|---|
| 2025 | $45,477 | $3,837,947 | $768,740 | $3,069,207 |
| 2024 | $45,477 | $3,762,694 | $753,667 | $3,009,027 |
| 2023 | $44,657 | $3,688,917 | $738,890 | $2,950,027 |
| 2022 | $43,377 | $3,616,586 | $724,402 | $2,892,184 |
| 2021 | $42,109 | $3,545,674 | $710,199 | $2,835,475 |
| 2019 | $40,894 | $3,440,509 | $689,135 | $2,751,374 |
| 2018 | $39,277 | $3,373,049 | $675,623 | $2,697,426 |
| 2016 | $37,694 | $3,242,072 | $649,389 | $2,592,683 |
| 2015 | $15,075 | $1,342,401 | $639,635 | $702,766 |
| 2014 | $14,574 | $1,316,106 | $627,106 | $689,000 |
Source: Public Records
Map
Nearby Homes
- 215 S Mccarty Dr
- 211 S Spalding Dr Unit 205N
- 211 S Spalding Dr Unit 110N
- 211 S Spalding Dr Unit 107N
- 211 S Spalding Dr Unit 603S
- 321 S Linden Dr
- 9900 S Santa Monica Blvd Unit 2D
- 9900 S Santa Monica Blvd Unit 3A
- 9900 S Santa Monica Blvd Unit 2F
- 9900 S Santa Monica Blvd Unit PHE
- 9950 Durant Dr Unit 504
- 9950 Durant Dr Unit 406
- 9950 Durant Dr Unit 209
- 133 S Bedford Dr
- 9601 Charleville Blvd Unit 5
- 9601 Charleville Blvd Unit 10
- 9660 W Olympic Blvd
- 9654 W Olympic Blvd
- 405 Shirley Place
- 232 S Rodeo Dr
- 213 S Linden Dr
- 221 S Linden Dr
- 209 S Linden Dr
- 225 S Linden Dr
- 216 S Spalding Dr
- 218 S Spalding Dr
- 212 S Spalding Dr Unit 1/2
- 212 S Spalding Dr
- 220 S Spalding Dr
- 222 S Spalding Dr
- 214 S Spalding Dr
- 205 S Linden Dr
- 229 S Linden Dr
- 208 S Spalding Dr
- 224 S Spalding Dr Unit 224 1/2
- 224 S Spalding Dr
- 224 S Spalding Dr Unit A.
- 226 S Spalding Dr
- 226 S Spalding Dr Unit A.
- 216 S Linden Dr