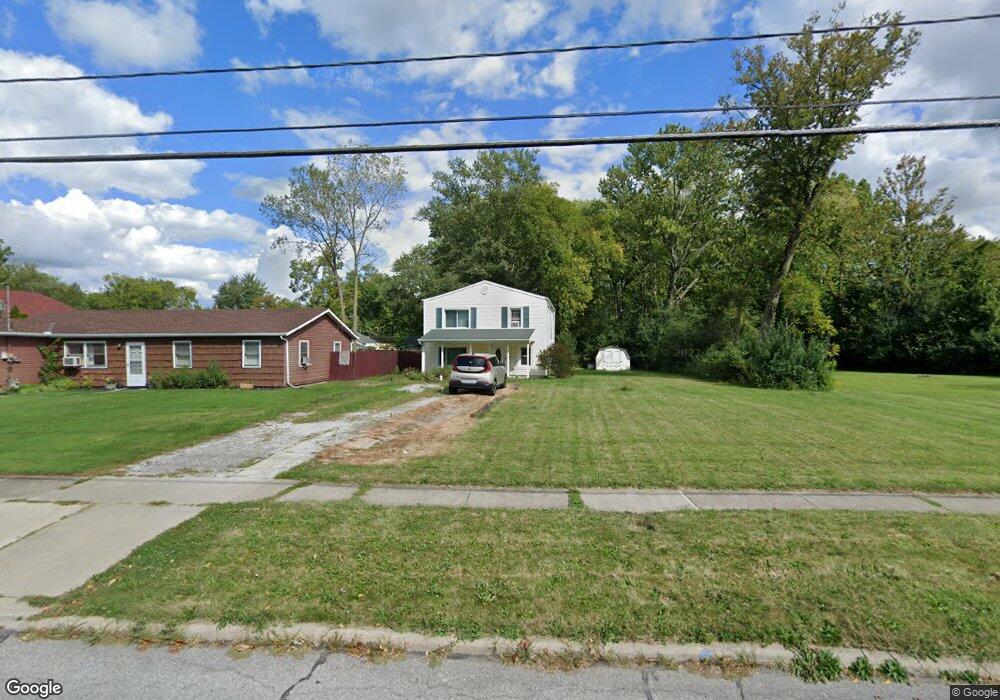
217 S Pleasant St Oberlin, OH 44074
Estimated Value: $152,000 - $211,000
4
Beds
2
Baths
1,560
Sq Ft
$116/Sq Ft
Est. Value
About This Home
This home is located at 217 S Pleasant St, Oberlin, OH 44074 and is currently estimated at $181,454, approximately $116 per square foot. 217 S Pleasant St is a home located in Lorain County with nearby schools including Oberlin Elementary School, Prospect Elementary School, and Langston Middle School.
Ownership History
Date
Name
Owned For
Owner Type
Purchase Details
Closed on
Jan 16, 2023
Sold by
Newson Megan M
Bought by
Newson Megan M
Current Estimated Value
Purchase Details
Closed on
Oct 7, 2022
Sold by
Newson Cleatrice
Bought by
Newson Megan
Purchase Details
Closed on
Nov 2, 2018
Sold by
Wall Terry
Bought by
Wall William G
Purchase Details
Closed on
Dec 14, 2006
Sold by
Pierce Gary L and Pierce Belinda
Bought by
Newson Cleatrice and Newson Megan M
Home Financials for this Owner
Home Financials are based on the most recent Mortgage that was taken out on this home.
Original Mortgage
$88,000
Interest Rate
6.33%
Mortgage Type
Purchase Money Mortgage
Purchase Details
Closed on
Feb 2, 2005
Sold by
Federal Home Loan Mortgage Corporation
Bought by
Pierce Gary L
Purchase Details
Closed on
Sep 3, 2004
Sold by
Drake Ernest and Estate Of Gwendolyn D Drake
Bought by
Federal Home Loan Mortgage Corporation
Purchase Details
Closed on
Mar 12, 2003
Sold by
Estate Of Gwendolyn Drake
Bought by
Drake Ernest
Create a Home Valuation Report for This Property
The Home Valuation Report is an in-depth analysis detailing your home's value as well as a comparison with similar homes in the area
Home Values in the Area
Average Home Value in this Area
Purchase History
| Date | Buyer | Sale Price | Title Company |
|---|---|---|---|
| Newson Megan M | -- | None Listed On Document | |
| Newson Megan | -- | -- | |
| Wall William G | $14,756 | None Available | |
| Newson Cleatrice | $88,000 | Elta | |
| Pierce Gary L | $15,000 | -- | |
| Federal Home Loan Mortgage Corporation | $32,000 | -- | |
| Drake Ernest | -- | -- |
Source: Public Records
Mortgage History
| Date | Status | Borrower | Loan Amount |
|---|---|---|---|
| Previous Owner | Newson Cleatrice | $88,000 |
Source: Public Records
Tax History Compared to Growth
Tax History
| Year | Tax Paid | Tax Assessment Tax Assessment Total Assessment is a certain percentage of the fair market value that is determined by local assessors to be the total taxable value of land and additions on the property. | Land | Improvement |
|---|---|---|---|---|
| 2024 | $2,489 | $49,910 | $8,491 | $41,419 |
| 2023 | $2,037 | $35,651 | $8,302 | $27,349 |
| 2022 | $1,939 | $35,651 | $8,302 | $27,349 |
| 2021 | $1,933 | $35,651 | $8,302 | $27,349 |
| 2020 | $1,800 | $31,250 | $7,280 | $23,970 |
| 2019 | $1,773 | $31,250 | $7,280 | $23,970 |
| 2018 | $1,785 | $31,250 | $7,280 | $23,970 |
| 2017 | $1,539 | $28,030 | $5,660 | $22,370 |
| 2016 | $1,554 | $28,030 | $5,660 | $22,370 |
| 2015 | $1,556 | $28,030 | $5,660 | $22,370 |
| 2014 | $1,504 | $26,440 | $5,340 | $21,100 |
| 2013 | $1,478 | $26,440 | $5,340 | $21,100 |
Source: Public Records
Map
Nearby Homes
- 62 Locust St
- 83 S Pleasant St
- 44 W Vine St
- 81 S Professor St
- 359 S Pleasant St
- 360 S Main St
- 147 Morgan St
- 149 Morgan St
- 63 Spring St
- 182 E Hamilton St
- 110 Shipherd Cir
- 111 N Pleasant St
- 235 Elm St
- 95 Shipherd Cir
- 257 Morgan St
- 232 Elm St
- 263 W Lincoln St
- 246 W Hamilton St
- 216 N Main St
- 230 N Main St
- 213 S Pleasant St
- 225 S Pleasant St
- 89 Locust St
- 233 S Pleasant St
- 93 Locust St
- 228 S Pleasant St
- 208 S Pleasant St
- 218 S Pleasant St
- 99 Locust St
- 237 S Pleasant St
- 107 Locust St
- 90 Locust St
- 52 Edison St
- 96 Locust St
- 115 Locust St
- 181 S Pleasant St
- 54 Locust St
- 100 Locust St
- 255 S Pleasant St
- 46 Edison St