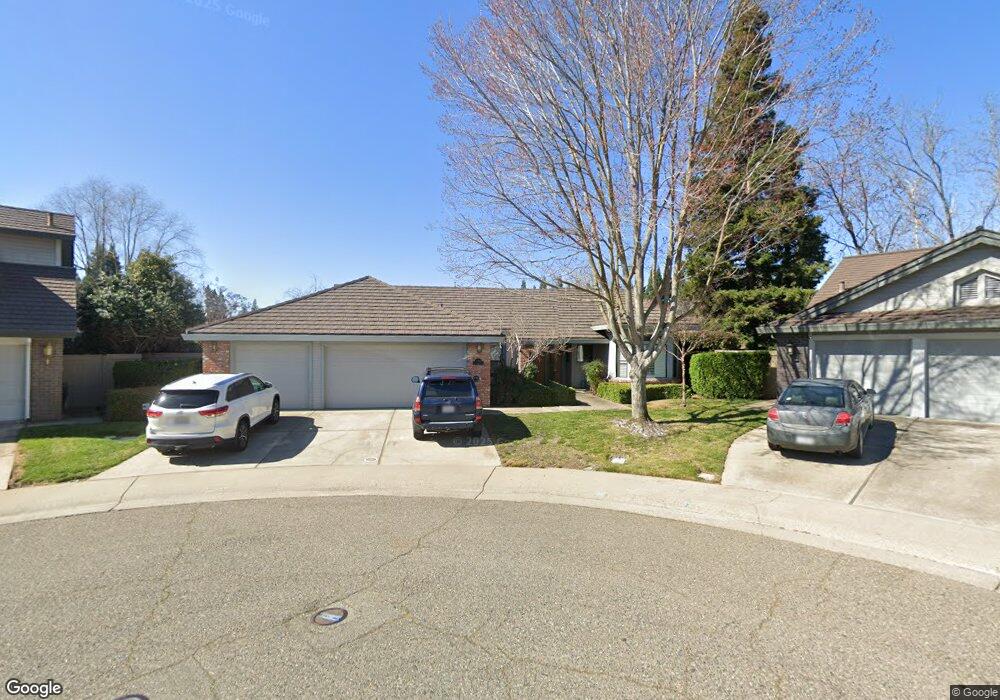
2170 Pilot Creek Ct Gold River, CA 95670
Estimated Value: $629,000 - $801,000
4
Beds
2
Baths
2,044
Sq Ft
$352/Sq Ft
Est. Value
About This Home
This home is located at 2170 Pilot Creek Ct, Gold River, CA 95670 and is currently estimated at $720,508, approximately $352 per square foot. 2170 Pilot Creek Ct is a home located in Sacramento County with nearby schools including Gold River Discovery Center, Rio Americano High School, and Summit Christian School.
Ownership History
Date
Name
Owned For
Owner Type
Purchase Details
Closed on
Nov 19, 2024
Sold by
Sant John Paul and Sant Jennifer
Bought by
Shigeko Koyama Revocable Living Trust and Koyama
Current Estimated Value
Purchase Details
Closed on
Nov 1, 2002
Sold by
Sant John Paul and Sant Jennifer
Bought by
Sant John Paul and Sant Jennifer
Home Financials for this Owner
Home Financials are based on the most recent Mortgage that was taken out on this home.
Original Mortgage
$210,650
Interest Rate
5.88%
Purchase Details
Closed on
May 17, 1999
Sold by
Judeth A Young Revocable Trust and Judeth A
Bought by
Sant John Paul and Koyama Jennifer
Home Financials for this Owner
Home Financials are based on the most recent Mortgage that was taken out on this home.
Original Mortgage
$212,400
Interest Rate
6.86%
Purchase Details
Closed on
Sep 14, 1994
Sold by
Young Judeth A
Bought by
Young Judeth A and Judeth A Young Revocable Trust
Create a Home Valuation Report for This Property
The Home Valuation Report is an in-depth analysis detailing your home's value as well as a comparison with similar homes in the area
Home Values in the Area
Average Home Value in this Area
Purchase History
| Date | Buyer | Sale Price | Title Company |
|---|---|---|---|
| Shigeko Koyama Revocable Living Trust | $685,000 | None Listed On Document | |
| Sant John Paul | -- | Chicago Title Company | |
| Sant John Paul | $236,000 | Fidelity National Title Co | |
| Young Judeth A | -- | -- |
Source: Public Records
Mortgage History
| Date | Status | Borrower | Loan Amount |
|---|---|---|---|
| Previous Owner | Sant John Paul | $210,650 | |
| Previous Owner | Sant John Paul | $212,400 |
Source: Public Records
Tax History
| Year | Tax Paid | Tax Assessment Tax Assessment Total Assessment is a certain percentage of the fair market value that is determined by local assessors to be the total taxable value of land and additions on the property. | Land | Improvement |
|---|---|---|---|---|
| 2025 | $4,481 | $685,000 | $175,000 | $510,000 |
| 2024 | $4,481 | $362,702 | $92,205 | $270,497 |
| 2023 | $4,367 | $355,592 | $90,398 | $265,194 |
| 2022 | $4,341 | $348,621 | $88,626 | $259,995 |
| 2021 | $4,268 | $341,787 | $86,889 | $254,898 |
| 2020 | $4,188 | $338,284 | $85,999 | $252,285 |
| 2019 | $4,103 | $331,652 | $84,313 | $247,339 |
| 2018 | $4,054 | $325,150 | $82,660 | $242,490 |
| 2017 | $4,013 | $318,776 | $81,040 | $237,736 |
| 2016 | $3,704 | $312,526 | $79,451 | $233,075 |
| 2015 | $3,641 | $307,832 | $78,258 | $229,574 |
| 2014 | $3,484 | $301,803 | $76,726 | $225,077 |
Source: Public Records
Map
Nearby Homes
- 11864 S Carson Way
- 11871 Silver Cliff Way
- 11858 Point Rock Way
- 11909 Rising Sun Way
- 11950 Rising Sun Way
- 2127 Gold Haven Ct
- 11939 Old Eureka Way
- 2046 Texas Bar Ct
- 2050 Campton Cir
- 12032 Gold Pointe Ln
- 11647 Gold Country Blvd
- 11604 Blazing Star Ct Unit 9
- 11540 Bear Valley Ct
- 2016 Idaho Mine Ct
- 11552 Marissa Way
- 1957 Empire Oaks Ct
- 8728 Bluff Ln Unit 3
- 8899 Bluff Ln
- 2024 Empire Mine Cir
- 11476 Hesperian Cir
- 2178 Pilot Creek Ct
- 2171 Pilot Creek Ct
- 11660 N Carson Way
- 11664 N Carson Way
- 2169 Nugget Creek Ct
- 2165 Nugget Creek Ct
- 11668 N Carson Way
- 2182 Pilot Creek Ct
- 11656 N Carson Way
- 2175 Pilot Creek Ct
- 2179 Pilot Creek Ct
- 11674 N Carson Way
- 2171 Nugget Creek Ct
- 11859 S Carson Way
- 2186 Pilot Creek Ct
- 11925 S Carson Way
- 2185 Pilot Creek Ct
- 11855 S Carson Way
- 2145 Woods Creek Ct
- 11919 S Carson Way
Your Personal Tour Guide
Ask me questions while you tour the home.