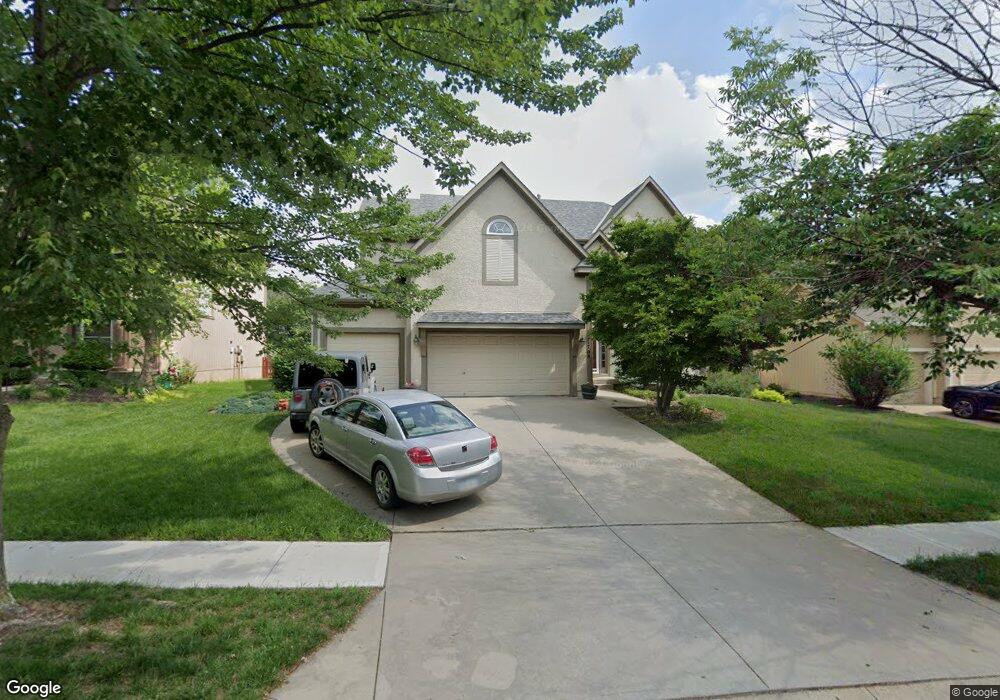
21708 W 99th Terrace Lenexa, KS 66220
Estimated Value: $565,900 - $587,000
5
Beds
6
Baths
2,720
Sq Ft
$213/Sq Ft
Est. Value
About This Home
This home is located at 21708 W 99th Terrace, Lenexa, KS 66220 and is currently estimated at $579,725, approximately $213 per square foot. 21708 W 99th Terrace is a home located in Johnson County with nearby schools including Manchester Park Elementary School, Prairie Trail Middle School, and Olathe Northwest High School.
Ownership History
Date
Name
Owned For
Owner Type
Purchase Details
Closed on
Dec 28, 2009
Sold by
Stasi Dominick Pat and Stasi Julie Ann
Bought by
Johnson Philip S and Johnson Annette M
Current Estimated Value
Home Financials for this Owner
Home Financials are based on the most recent Mortgage that was taken out on this home.
Original Mortgage
$135,000
Interest Rate
4.33%
Mortgage Type
New Conventional
Purchase Details
Closed on
Feb 4, 2002
Sold by
True Builders Inc
Bought by
Stasi Dominick Pat and Stasi Julie Ann
Home Financials for this Owner
Home Financials are based on the most recent Mortgage that was taken out on this home.
Original Mortgage
$237,139
Interest Rate
7.11%
Purchase Details
Closed on
Oct 22, 2001
Sold by
Manchester Partners Llc
Bought by
True Builders Inc
Home Financials for this Owner
Home Financials are based on the most recent Mortgage that was taken out on this home.
Original Mortgage
$220,000
Interest Rate
6.84%
Mortgage Type
Construction
Create a Home Valuation Report for This Property
The Home Valuation Report is an in-depth analysis detailing your home's value as well as a comparison with similar homes in the area
Home Values in the Area
Average Home Value in this Area
Purchase History
| Date | Buyer | Sale Price | Title Company |
|---|---|---|---|
| Johnson Philip S | -- | Chicago Title Insurance Co | |
| Stasi Dominick Pat | -- | Security Land Title Company | |
| True Builders Inc | -- | Security Land Title Company |
Source: Public Records
Mortgage History
| Date | Status | Borrower | Loan Amount |
|---|---|---|---|
| Closed | Johnson Philip S | $135,000 | |
| Previous Owner | Stasi Dominick Pat | $237,139 | |
| Previous Owner | True Builders Inc | $220,000 |
Source: Public Records
Tax History Compared to Growth
Tax History
| Year | Tax Paid | Tax Assessment Tax Assessment Total Assessment is a certain percentage of the fair market value that is determined by local assessors to be the total taxable value of land and additions on the property. | Land | Improvement |
|---|---|---|---|---|
| 2024 | $6,885 | $56,051 | $10,519 | $45,532 |
| 2023 | $6,455 | $51,554 | $10,022 | $41,532 |
| 2022 | $6,112 | $47,599 | $9,113 | $38,486 |
| 2021 | $5,679 | $42,032 | $8,679 | $33,353 |
| 2020 | $5,547 | $40,652 | $8,679 | $31,973 |
| 2019 | $5,612 | $40,837 | $7,549 | $33,288 |
| 2018 | $5,245 | $37,720 | $7,549 | $30,171 |
| 2017 | $5,352 | $37,674 | $6,036 | $31,638 |
| 2016 | $5,053 | $36,363 | $6,618 | $29,745 |
| 2015 | $4,912 | $35,351 | $6,618 | $28,733 |
| 2013 | -- | $31,659 | $6,618 | $25,041 |
Source: Public Records
Map
Nearby Homes
- 22076 W 99th Terrace
- 22017 W 99th Terrace
- 22029 W 99th Terrace
- 21901 W 99th Terrace
- 22005 W 99th Terrace
- 22077 W 99th Terrace
- 21913 W 99th Terrace
- 21925 W 99th Terrace
- 21926 W 99th Terrace
- 10026 Aurora St
- 10041 Aurora St
- 21938 W 99th Terrace
- 22064 W 99th Terrace
- 21522 W 98th Terrace
- 22051 W 100th Terrace
- 22063 W 100th Terrace
- 22087 W 100th Terrace
- 9927 Brockway St
- 9950 Brockway St
- 9962 Brockway St
- 21704 W 99th Terrace
- 21712 W 99th Terrace
- 21705 W 99th St
- 21716 W 99th Terrace
- 21701 W 99th St
- 21707 W 99th Terrace
- 21711 W 99th Terrace
- 21713 W 99th St
- 21715 W 99th Terrace
- 21619 W 99th St
- 21703 W 99th Terrace
- 21616 W 99th Terrace
- 21720 W 99th Terrace
- 21719 W 99th Terrace
- 21621 W 99th Terrace
- 21717 W 99th St
- 21615 W 99th St
- 21612 W 99th Terrace
- 21706 W 100th St
- 21710 W 100th St